|
| |
|
Main Newsletter Index
Multi-Scale
A Layman's
|
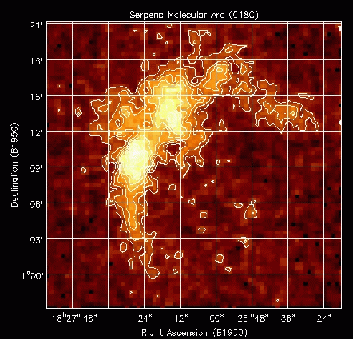
CO in Serpens Joseph McMullin - NRAO/Charlottesville Image of integrated C18O J=1-0 emission in Serpens. The image shown is the nearby (distance=220 pc) stellar factory in Serpens as seen in its integrated C18O J=1-0 emission, as observed by the NRAO 12-meter telescope. This molecule traces the overall column density structure in the region. The backbone of the cloud is an arc curving through roughly 180 degrees, with a length of 30'. Two main peaks in the C18O emission are located near the center of the arc, separated by 4'. The Submillimeter and far infrared continuum emission from the region are dominated by sources that lie primarily *between* the two C18O peaks, including a cluster of 50-140 young stars. A first moment map of the C18O emission displays a broad velocity gradient running from a velocity centroid of 9.0 km/s at the northwest end to 7.5 km/s at the southeast end. It is unclear whether this gradient arises from rotation, two clouds at different velocities or interaction of cloud material with recent star formation. In the paper on this source published earlier this year (McMullin et al. 2000, Ap. J., 536, 845), five different software packages were used to examine the array of data: 1) AIPS for reduction of NRAO 12-m OTF data, 2) CLASS and 3) COMB for analysis of single dish spectra from the CSO and NRAO 12-m, 4) MIRIAD for analysis of the BIMA interferometric data and 5) WIP for fashioning the final, publication-quality figures. While the calibration had been done, I threw in a sixth package, AIPS++, to explore better, more streamlined avenues for reducing a diverse set of data, which is typically the norm rather than the exception in observational astronomy. Overall, I was pleased with the capabilities of the images and viewer modules in particular. It was gratifying to obtain the same answers as I had measured in MIRIAD (which I'm quite fond of). In addition, I found these tools better for exploring the data; interactively examining the structure on both the large and small scales is one of the more versatile tools handed to you in the AIPS++ GUI. The ability to script (or construct a command line record of your sundry GUI button clicks) was also a valuable addition for streamlining future reductions. In general it was my experience that the basic toolkit has grown to house quite an array of analysis tools, so it's more a question of finding the name of the task you need than whether you can perform an operation. I look forward to completing my next data set as the previous battery of packages can now be replaced, from calibration->imaging->figure production, with AIPS++.
|
|
Main Newsletter Index
Multi-Scale
A Layman's
|
Using AIPS++ in the Research Experience for Teachers (RET) Program Tim Spuck - Oil City Area Sr High School, Oil City, Pennsylvania The HI luminosity-linewidth profile method is a valuable tool in radio astronomy. Among other things, it helps astronomers determine distances, rotation velocities, and hydrogen composition for distant galaxies. During my summer Research Experience for Teachers (RET), I worked with J. Richard Fisher at the National Radio Astronomy Observatory in Green Bank. This past October, Dr. Fisher used the Arecibo Radio Telescope to collect data for over 500 galaxies; my job was to reduce this data. The data helps to support research completed with the Infrared Astronomical Satellite and provide a comparison of luminosity-linewidth and supernovae Ia distance scales. In order to complete the task I had to first acquire a working knowledge of AIPS++ and Glish, the command and scripting language of AIPS++; Glish allows users easy access to all AIPS++ analysis routines and provides a means of writing customized applications by bundling together collections of commands into new functions. This past summer, Dr. Fisher and I wrote AIPS++ scripts that would implement data correction factors, display data scans, and assist in making precise measurements. As a volunteer researcher, I plan to continue my work with this project during the coming school year. I will be installing AIPS++ on a Linux machine at my school in Oil City, PA using the latest version of AIPS++ on CD. Selected students will train and assist me in completing the data reduction process for these galaxies. In any science education program whether it be elementary school or college, it is crucial that students be provided the opportunity to experience science rather than to simply be told about it. If anything this summer, I've become even more convinced that science is active, not passive. Science is a vehicle by which man contributes to his understanding of the universe around him. Thanks to my RET experience, my students will be going on a little "drive" this year.
|
|
Main Newsletter Index
Multi-Scale
A Layman's
|
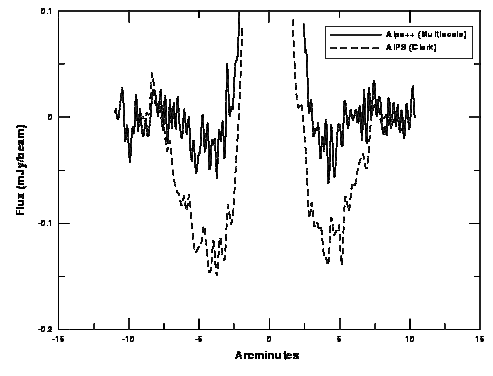
Multi-Scale Clean for Extended Structure Jason Peterson - NMSU
 A slice through NGC 4631's minor axis shows the relative performance of Multi-Scale Clean (solid line) and Clark Clean (dashed line). We have used the Multi-Scale Clean algorithm in AIPS++ in an effort to characterize the faint emission from radio halos. The negative bowl caused by the missing short spacings problem can have a serious impact on the analysis of such emission. Figure S2 shows a minor axis profile across the egde-on galaxy NGC 4631 from VLA C-array data at 1.4 GHz. It is obvious from the plot that the Multi-Scale Clean algorithm is superior to the standard Clark Clean in compensating for the effects of the negative bowl surrounding the source. The benefits gained in the outer regions of the halo are not insignificant, amounting to an increase in scale height of the extended component by almost 25 percent over the Clark algorithm. The addition of D-array data substantially improves the situation by adding more short spacings, but Multi-Scale Clean is still a marked improvement over the Clark Clean, all but eliminating the negative bowl.
|
|
Main Newsletter Index
Multi-Scale
A Layman's
|
Backing into AIPS++ -- a Layman's Experience F. J. Lockman - NRAO/Green Bank
 Editor's note: This article traces the path of a non-programmer astronomer learning how to program in AIPS++ at the Glish level in order to perform customized scientific calculations. It frankly lays out both the frustrations one might expect to encounter on this path and the ease and power of Glish/AIPS++ programming once you have learned how to use these tools. The bottom line is best summarized by Jay's concluding remark: "I have found Glish/AIPS++ a major advance over other software tools that I have used and recommend it to anyone looking for a general purpose package for analysis of astronomical data."
Some months ago while trying to model a large HI cloud seen in 21cm emission and self-absorption against the galactic HI background, I was faced with the need to make some simple but rather extensive calculations. At Green Bank, I am surrounded by people using glish and developing AIPS++, so it was a natural temptation to play with these new tools for what I thought would be just a few day's worth of modelling. By the time the project was finished, months later, I had written several large glish scripts, each with hundreds of lines of code, and had analyzed several large spectral-line data sets using glish/AIPS++ functions. The results will appear in a forthcoming issue of the ApJ; here I have been asked to write about the experience and what lessons might be offered to others who would use the AIPS++ system as a general computing tool. I must warn readers that I have a very unclear understanding of how the tools I used fit into the greater scheme of AIPS++ and likely much of what I think I understand is incorrect. In particular, I will refer to glish and AIPS++ without a clear distinction between them because that is how I used them. I "backed into" AIPS++ by adopting a "bottom-up" approach, that is, by using glish in a primitive way, and only incorporating AIPS++ functions where necessary. But perhaps the lesson is that this system can be quite useful even if it is not understood at all. I began the project in total ignorance of AIPS++ and glish, but armed with Rick Fisher's excellent Note Getting Started with Glish for AIPS++ and as important, with Rick himself just down the hall, within a short time I was manipulating arrays in the effortless way that glish encourages. In fact, if there is one major impression I have of working in glish, its that most things are either effortless or impossible. But more on this later. I was quite impressed on the ease with which simple radiative transfer problems could be coded in glish, and the results displayed using the built-in pgplot functions. It was a short step to incorporating AIPS++ functions in the code, creating AIPS++ images from arrays, convolving the images to mimic observations with a radio telescope, and so on. A few months later the results were in hand, and it had been a satisfactory experience. I now find myself beginning a totally different project, again using the Glish environment. It has become my default language for data analysis and modeling. Here are a few general impressions derived from this experience:
If you are considering giving glish/AIPS++ a try, here are a few suggestions
that may ease your way:
It is easy to criticize, so I do not want to leave an unfavorable impression of my experiences. Despite its current problems, many of which are due no doubt to teething pains, I have found Glish/AIPS++ a major advance over other software tools that I have used and recommend it to anyone looking for a general purpose package for analysis of astronomical data.
Mark Holdaway |
