 National Radio
Astronomy Observatory
|
|
|||
| NRAO Home > CASA > CASA Cookbook and User Reference Manual |
|
||
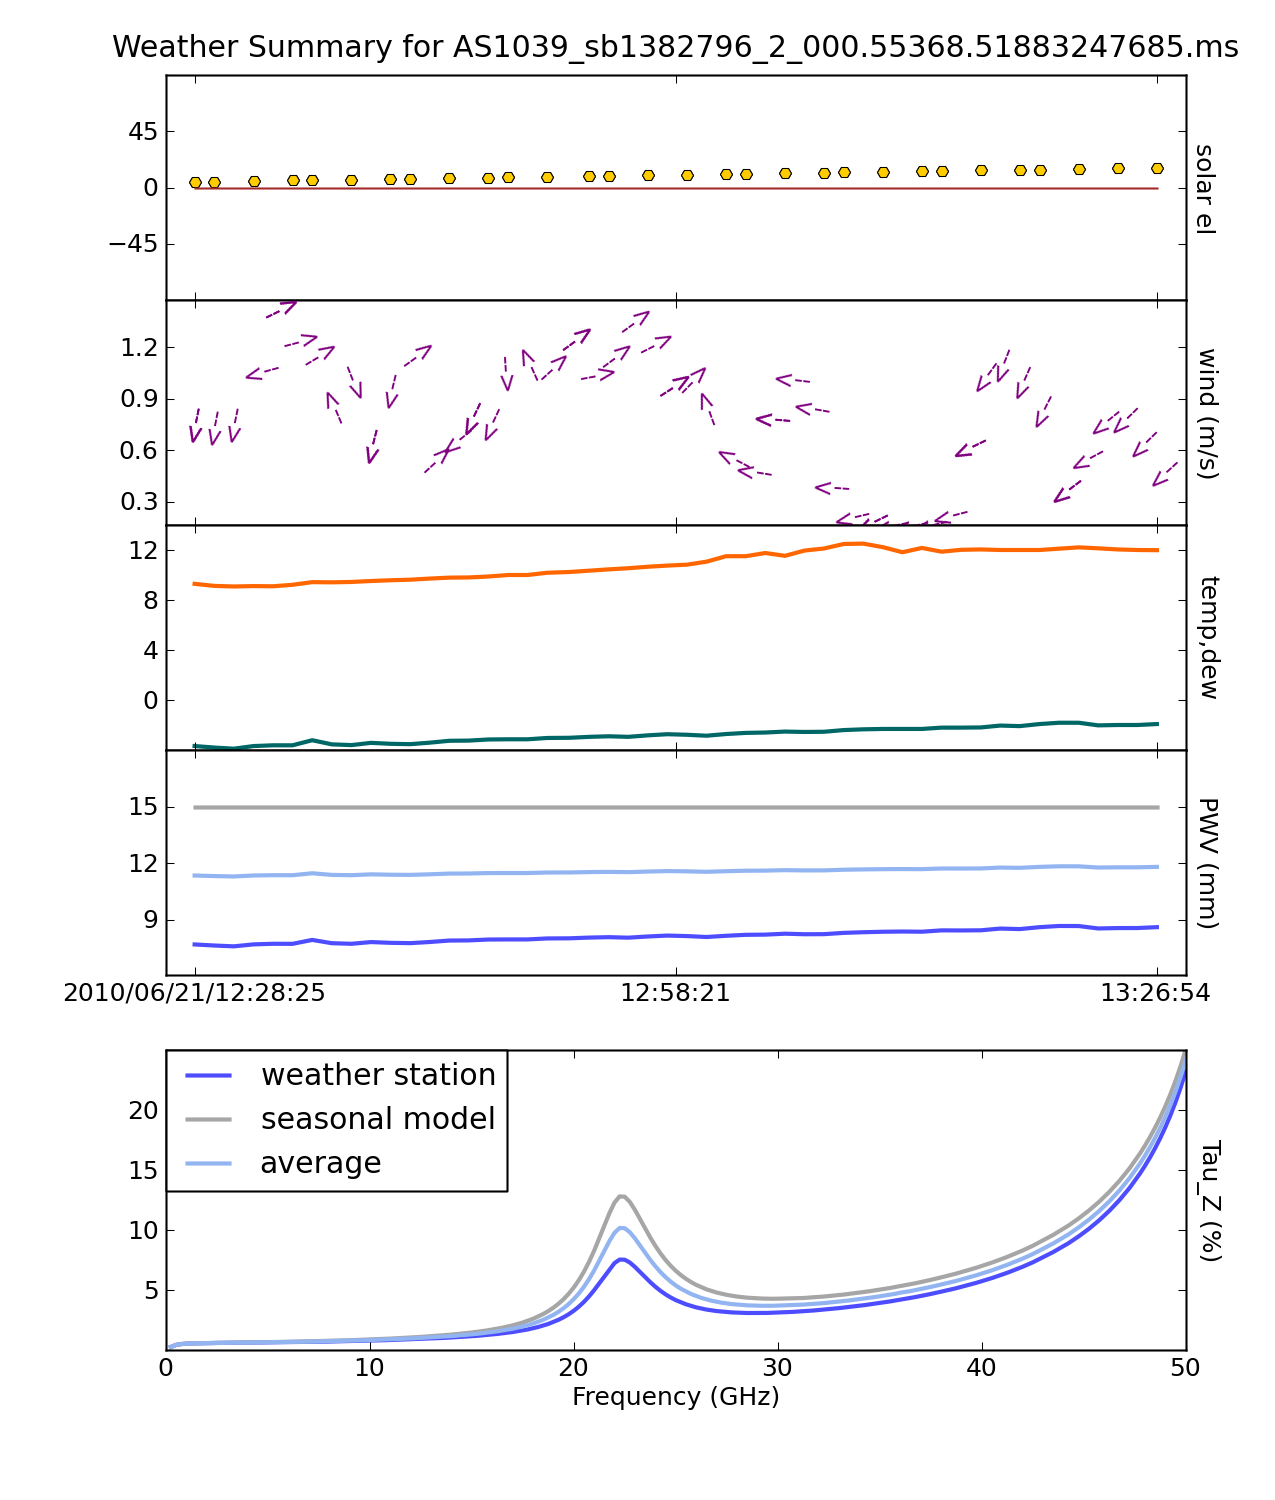
4.3.3.1 Determining opacity corrections for JVLA data
For the JVLA site, weather statistics and/or seasonal models that average over many years of weather statistics prove to be reasonable good ways to estimate the opacity at the time of the observations. The task plotweather calculates the opacity as a mix of both actual weather data and seasonal model. It has the following inputs:
vis = ’’ # MS name
seasonal_weight = 0.5 # weight of the seasonal model
doPlot = True # set this to True to create a plot
async = False # If true the taskname must be started using plotweather(...)
The task plots the weather statistics if doPlot=T, like shown in Figure 4.3. The bottom panel displays the calculated opacities for the run as well as a seasonal model. The parameter seasonal_weight can be adjusted to calculate the opacities as a function of the weather data alone seasonal_weight=0, only the seasonal model seasonal_weight=1, or a mix of the two (values between 0 and 1). Calculated opacities are shown in the logger output, one for each spectral window. plotweather can also assign a python variable to a list of calculated opacities (one entry for each spw) when run as:
in that example, myTau will be returned with, e.g. myTau=[0.02,0.03] and can later be used as input for the opacity parameter in a number of calibration tasks (opacity=myTau or opacity=[0.02,0.03]).
_________________________________________________________________________________________
More information about CASA may be found at the
CASA web page
Copyright © 2010 Associated Universities Inc., Washington, D.C.
This code is available under the terms of the GNU General Public Lincense
Home |
Contact Us |
Directories |
Site Map |
Help |
Privacy Policy |
Search