 National Radio
Astronomy Observatory
|
|
|||
| NRAO Home > CASA > CASA Cookbook and User Reference Manual |
|
||
4.5.1.1 Examples for plotcal
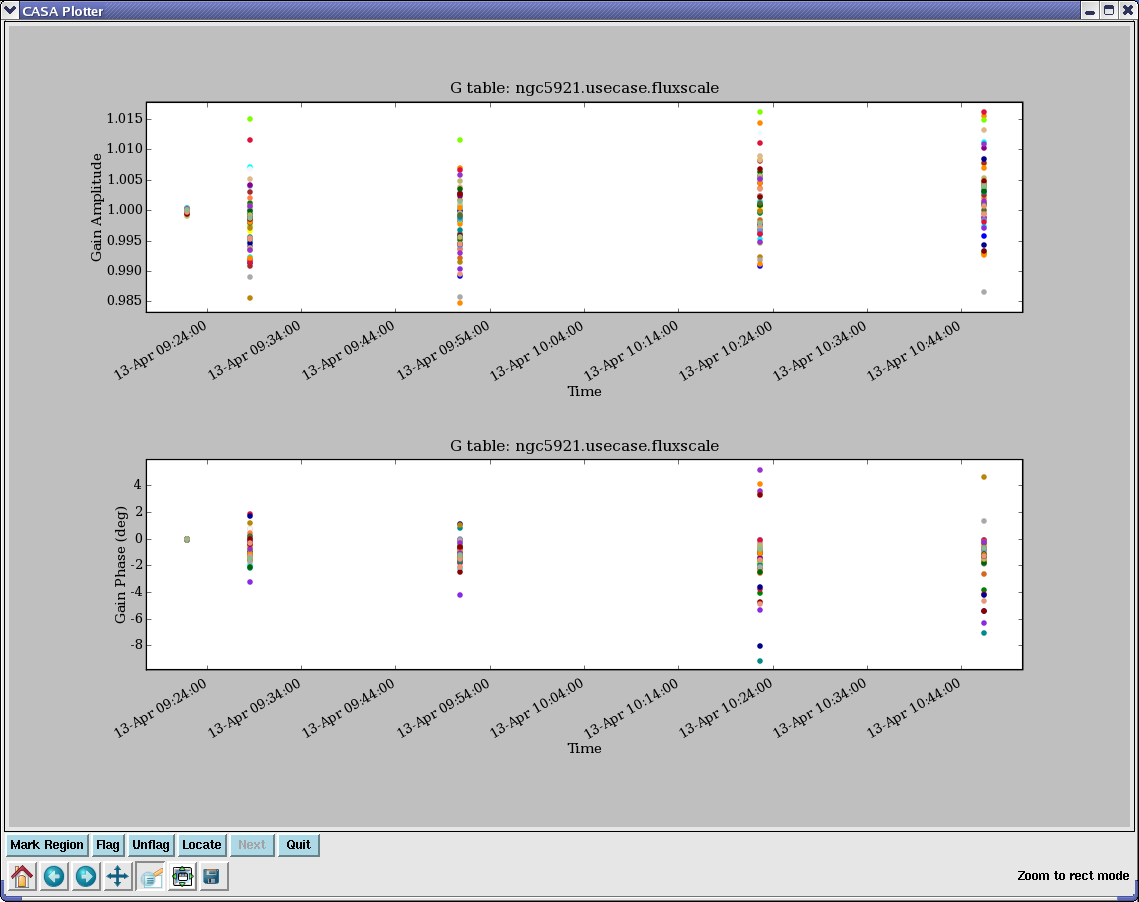
For example, to plot amplitude or phase as a function of time for ’G’ solutions (after rescaling by fluxscale for the NGC5921 “demo” data (see Appendix F.1),
fontsize = 14.0 # Make labels larger
markersize = 10.0 # Make dots bigger
caltable = ’ngc5921.usecase.fluxscale’
yaxis = ’amp’
subplot = 211
plotcal()
yaxis = ’phase’
subplot = 212
plotcal()
The results are shown in Figure 4.5. This makes use of the subplot option to make multi-panel displays.
_________________________________________________________________________________________
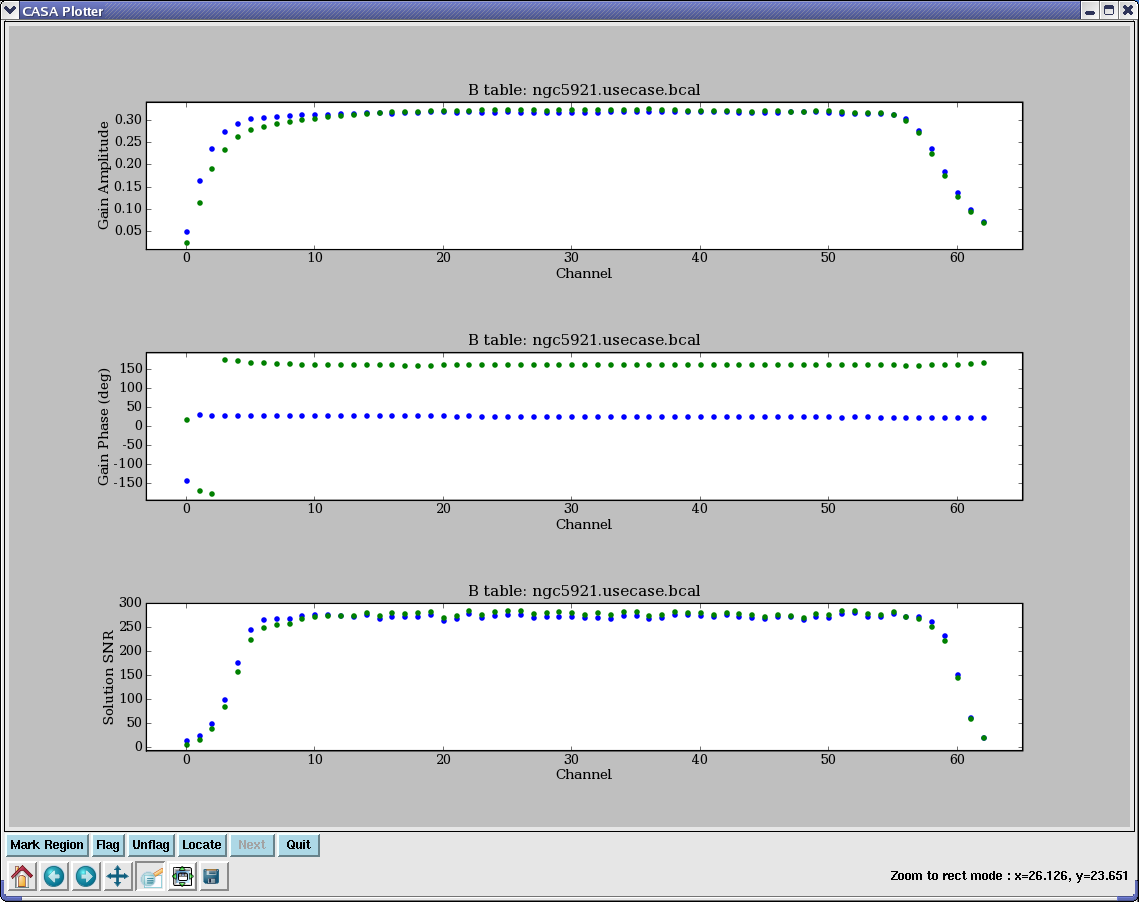
Similarly, to plot amplitude or phase as a function of channel for ’B’ solutions for NGC5921:
fontsize = 14.0 # Make labels larger
markersize = 10.0 # Make dots bigger
caltable = ’ngc5921.usecase.bcal’
antenna = ’1’
yaxis = ’amp’
subplot = 311
plotcal()
yaxis = ’phase’
subplot = 312
plotcal()
yaxis = ’snr’
subplot = 313
plotcal()
The results are shown in Figure 4.6. This stacks three panels with amplitude, phase, and signal-to-noise ratio. We have picked antenna=’1’ to show.
_________________________________________________________________________________________
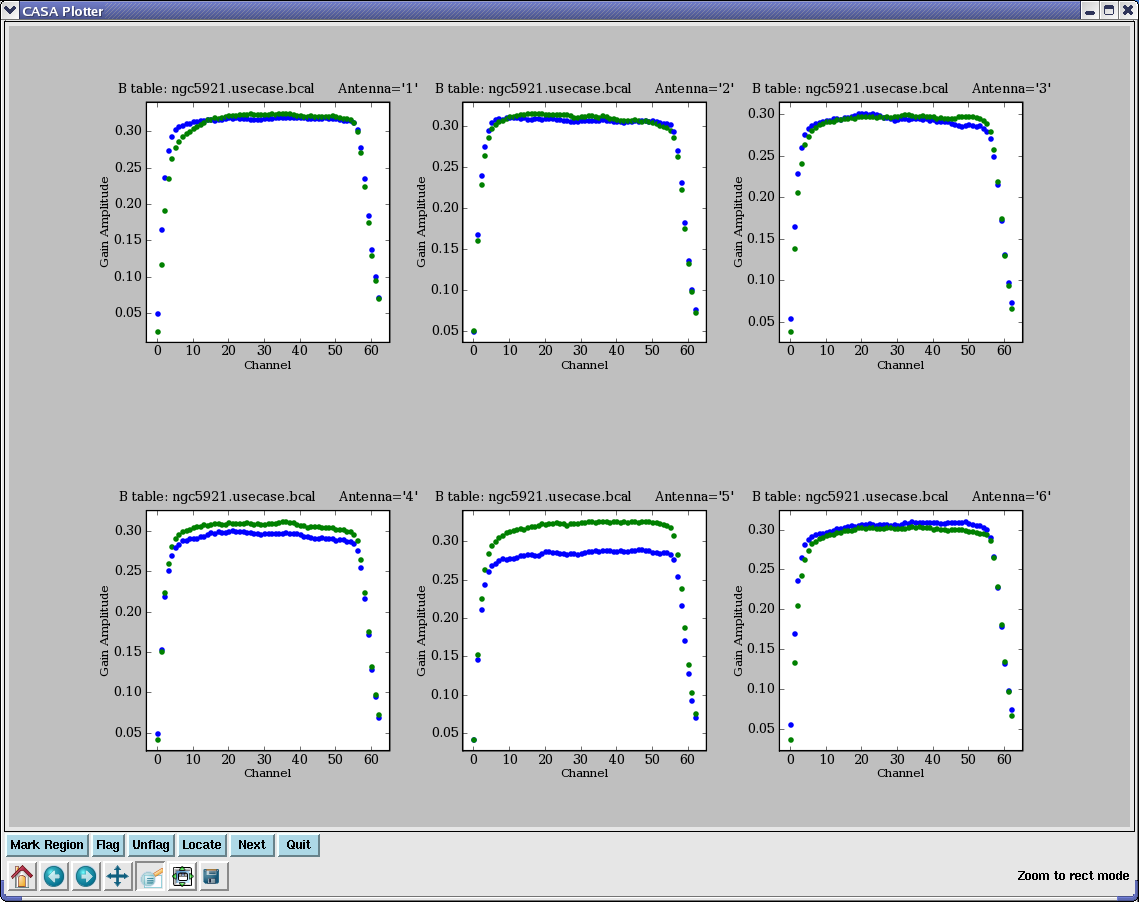
For example, to show 6 plots per page of ’B’ amplitudes on a 3 × 2 grid:
fontsize = 12.0 # Make labels just large enough
markersize = 10.0 # Make dots bigger
caltable = ’ngc5921.usecase.bcal’
yaxis = ’amp’
subplot = 231
iteration = ’antenna’
plotcal()
See Figure 4.7 for this example. This uses the iteration parameter.
_________________________________________________________________________________________
More information about CASA may be found at the
CASA web page
Copyright © 2010 Associated Universities Inc., Washington, D.C.
This code is available under the terms of the GNU General Public Lincense
Home |
Contact Us |
Directories |
Site Map |
Help |
Privacy Policy |
Search