 National Radio
Astronomy Observatory
|
|
|||
| NRAO Home > CASA > CASA Cookbook and User Reference Manual |
|
||
4.6.2 Examine the Calibrated Data
Once the source data is calibrated using applycal, you should examine the uv data and flag anything that looks bad. If you find source data that has not been flanked by calibration scans, delete it (it will not be calibrated).
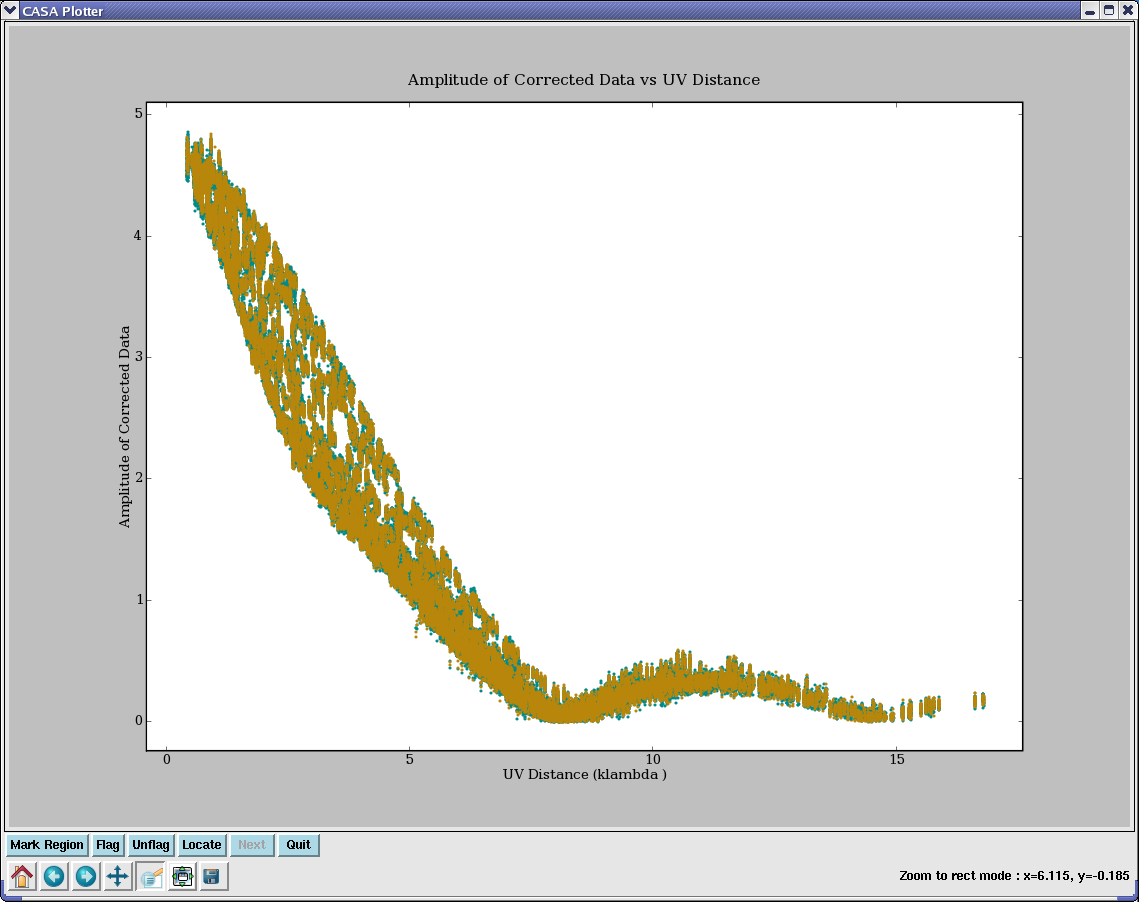
For example, to look at the calibrated Jupiter data in the last example given in the previous section:
selectdata=True,correlation=’RR LL’,fontsize = 14.0)
will show the CORRECTED_DATA column. See Figure 4.11.
_________________________________________________________________________________________
See § 3.3 for a description of how to display and edit data using plotms or plotxy, and § 7.4 for use of the viewer to visualize and edit a Measurement Set.
More information about CASA may be found at the
CASA web page
Copyright © 2010 Associated Universities Inc., Washington, D.C.
This code is available under the terms of the GNU General Public Lincense
Home |
Contact Us |
Directories |
Site Map |
Help |
Privacy Policy |
Search