 National Radio
Astronomy Observatory
|
|
|||
| NRAO Home > CASA > CASA Cookbook and User Reference Manual |
|
||
7.2.1 The Viewer Display Panel
The Viewer Display Panel is the the window that actually displays the image or MS. This is shown in the left panels of Figures 7.1 and 7.2. Note that this panel is the same whether an image or MS is being displayed.
At the top of the Viewer Display Panel are the menus:
- Data
- Open — choose a data file to load and display
- Register — select/de-select the (previously-loaded) data file(s) which should display right now (menu expands to the right showing all loaded data)
- Close — close (unload) selected data file (menu expands to the right)
- Adjust — open the Data Display Options (’Adjust’) panel
- Save as... — save/export data to a file
- Print — print the displayed image
- Save Panel State — to a ’restore’ file (xml format)
- Restore Panel State — from a restore file
- Close Panel — close the Viewer Display Panel (will exit if this is the last display panel open)
- Quit Viewer — close all display panels and exit
- Display Panel
- New Panel — create another Viewer Display Panel (cleared)
- Panel Options — open the Display Panel’s options window
- Save Panel State
- Restore Panel State
- Print — print displayed image
- Close Panel — close the Viewer Display Panel (will exit if this is the last display panel open)
- Tools
- Spectral Profile — plot frequency/velocity profile of point or region of image
- View
- Main Toolbar — show/hide top row of icons
- Mouse Toolbar — show/hide second row of mouse-button action selection icons
- Animator — show/hide tapedeck control panel
- Position Tracking — show/hide bottom position tracking report box
- regions — show/hide region box

_________________________________________________________________________________________
Below this is the Main Toolbar (Figure 7.3), the top row of icons for fast access to some of these menu items:
- folder (Data:Open shortcut) — show the Load Data panel
- wrench (Data:Adjust shortcut) — show the Data Display Options (’Adjust’) panel
- panels (Data:Register shortcut) — show the menu of loaded data
- delete (Data:Close shortcut) — closes/unloads selected data
- save data — save/export data to a file
- new panel (Display Panel:New Panel)
- panel wrench (Display Panel:Panel Options) — show the Display Panel’s options window
- save panel – save panel state to a ’restore’ file
- restore panel – restore panel state from a restore file
- profile panel – open the spectral profiler regions.
(Note: some of these newer buttons do not appear in older figures of this document).
- print (Display Panel:Print) — print data
- magnifier box — zoom out all the way
- magnifier plus — zoom in (by a factor of 2)
- magnifier minus — zoom out (by a factor of 2)
_________________________________________________________________________________________
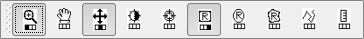
Below this are the ten Mouse Tool buttons (Figure 7.4). These allow assignment of each of the three mouse buttons to a different operation on the display area. Clicking a mouse tool icon will [re-]assign the mouse button that was clicked to that tool. The icons show which mouse button is currently assigned to which tool.
The ’escape’ key can be used to cancel any mouse tool operation that was begun but not completed, and to erase any tool showing in the display area.
- Zooming (magnifying glass icon): To zoom into a selected area, press the Zoom tool’s mouse button (the left button by default) on one corner of the desired rectangle and drag to the desired opposite corner. Once the button is released, the zoom rectangle can still be moved or resized by dragging. To complete the zoom, double-click inside the selected rectangle (double-clicking outside it will zoom out instead).
- Panning (hand icon): Press the tool’s mouse button on a point you wish to move, drag it to the position where you want it moved, and release. Note: The arrow keys, Page Up, Page Down, Home and End keys can also be used to scroll through your data any time you are zoomed in. (Click on the main display area first, to be sure the keyboard is ’focused’ there).
- Stretch-shift colormap fiddling (crossed arrows): This is usually the handiest color adjustment; it is assigned to the middle mouse button by default.
- Brightness-contrast colormap fiddling (light/dark sun)
- Positioning (bombsight): This tool can place a point marker on the display to select a position. It is used to flag Measurement Set data or to select an image position for spectral profiles. Click on the desired position with the tool’s mouse button to place the point; once placed you can drag it to other locations. You can also place multiple points on the display (e.g. for different spectral profile positions) – remove them by hovering over and hitting ESC. Double-click is not needed for this tool. See § 7.2.3 for more detail.
- Rectangle, Ellipse and Polygon region drawing: The rectangle region tool is assigned to the right mouse button by default. As with the zoom tool, a rectangle region is generated by dragging with the assigned mouse button; the selection is confirmed by double-clicking within the rectangle. An ellipse regions is created by dragging with the assigned mouse button. In addition to the elliptical region, also its surrounding rectangle is shown on the display. The selection is confirmed by double-clicking within the ellipse. Polygon regions are created by clicking the assigned mouse button at the desired vertices, clicking the final location twice to finish. Once created, a polygon can be moved by dragging from inside, or reshaped by dragging the handles at the vertices. Double-click inside to confirm region selection. See § 7.2.3 for the uses of this tool.
- Polyline drawing: A polyline can be created by selecting this tool. It is manipulated similarly to the polygon region tool: create segments by clicking at the desired positions and then double-click to finish the line. [Uses for this tool are still to be implemented].
- Distance tool: After selecting the distance tool by assigning any mouse button to it, distances on the image can conveniently be measured by dragging the mouse with the assigned button pressed. The tool measures the distances along the world coordinate axes and along the hypotenuse. If the units in both axes are [deg], the distances are displayed in [arcsec].
The main Display Area lies below the toolbars.
On the right side of the display area is an Animator panel. The most prominent feature is the “tape deck” which provides movement between image planes along a selected third dimension of an image cube. This set of buttons is only enabled when a registered image reports that it has more than one plane along its ’Z axis’. In the most common case, the animator selects the frequency channel. From left to right, the tape deck controls allow the user to:
- rewind to the start of the sequence (i.e., the first plane)
- step backwards by one plane
- play backwards, or repetitively step backwards
- stop any current play
- play forward, or repetitively step forward
- step forward by one plane
- fast forward to the end of the sequence
To the right of the tape deck is an editable text box indicating the current frame (channel) number and a label showing the total number of frames. Below that is a box for controlling the (nominal) animation speed. To the right is a ’normal/blink’ toggle.
’Blink’ mode is useful when more than one raster image is registered. In that mode, the tapedeck controls which image is displayed at the moment rather than the particular image plane (set that in ’Normal’ mode first). The registered images must cover the same portion of the sky and use the same coordinate projection.
Note: In ’normal’ mode, it is advisable to have only ONE raster image registered at a time, to avoid confusion. Unregister (or close) the others).
Underneath the Animator Panel is the Position Tracking panel. As the mouse moves over the main display, this panel shows information such as flux density, position (e.g. RA and Dec), Stokes, and frequency (or velocity), for the point currently under the cursor. Each registered image/MS displays its own tracking information. Tracking can be ’frozen’ (and unfrozen again) with the space bar. (Click on the main display area first, to be sure the keyboard is ’focused’ there).
The Animator or Tracking panels can be hidden or detached (and later re-attached) by using the boxes at upper right of the panels; this is useful for increasing the size of the display area. (Use the ’View’ menu to show a hidden panel again). The individual tracking areas (one for each registered image) can be hidden using the checkbox at upper left of each area.
More information about CASA may be found at the
CASA web page
Copyright © 2010 Associated Universities Inc., Washington, D.C.
This code is available under the terms of the GNU General Public Lincense
Home |
Contact Us |
Directories |
Site Map |
Help |
Privacy Policy |
Search