 National Radio
Astronomy Observatory
|
|
|||
| NRAO Home > CASA > CASA Cookbook and User Reference Manual |
|
||
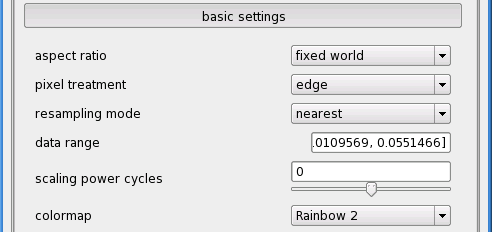
7.3.1.2 Raster image — basic settings
This roll-up is open by default. It has some commonly-used parameters that alter the way the image is displayed; three of these affect the colors used. An example of this part of the panel is shown in Figure 7.8.
_________________________________________________________________________________________
The options available are:
- basic settings: aspect ratio
This option controls the horizontal-vertical size ratio of data pixels on screen. fixed world (the default) means that the aspect ratio of the pixels is set according to the coordinate system of the image (i.e., true to the projected sky). fixed lattice means that data pixels will always be square on the screen. Selecting flexible allows the map to stretch independently in each direction to fill as much of the display area as possible.
- basic settings: pixel treatment
This option controls the precise alignment of the edge of the current ’zoom window’ with the data lattice. edge (the default) means that whole data pixels are always drawn, even on the edges of the display. For most purposes, edge is recommended. center means that data pixels on the edge of the display are drawn only from their centers inwards. (Note that a data pixel’s center is considered its ’definitive’ position, and corresponds to a whole number in ’data pixel’ or ’lattice’ coordinates).
- basic settings: resampling mode
This setting controls how the data are resampled to the resolution of the screen. nearest (the default) means that screen pixels are colored according to the intensity of the nearest data point, so that each data pixel is shown in a single color. bilinear applies a bilinear interpolation between data pixels to produce smoother looking images when data pixels are large on the screen. bicubic applies an even higher-order (and somewhat slower) interpolation.
- basic settings: data range
You can use the entry box provided to set the minimum and maximum data values mapped to the available range of colors as a list [min, max]. For very high dynamic range images, you will probably want to enter a max less than the data maximum in order to see detail in lower brightness-level pixels. The next setting also helps very much with high dynamic range data.
- basic settings: scaling power cycles
This option allows logarithmic scaling of data values to colormap cells.
The color for a data value is determined as follows: first, the value is clipped to lie within the data range specified above, then mapped to an index into the available colors, as described in the next paragraph. The color corresponding to this index is determined finally by the current colormap and its ’fiddling’ (shift/slope) and brightness/contrast settings (see Mouse Toolbar, above). Adding a color wedge to your image can help clarify the effect of the various color controls.
The scaling power cycles option controls the mapping of clipped data values to colormap indices. Set to zero (the default), a straight linear relation is used. For negative scaling values, a logarithmic mapping assigns an larger fraction of the available colors to lower data values (this is usually what you want). Setting dataMin to something around the noise level is often useful/appropriate in conjunction with a negative ’power cycles’ setting.
For positive values, an larger fraction of the colormap is used for the high data values1.
See Figure 7.9 for sample curves.
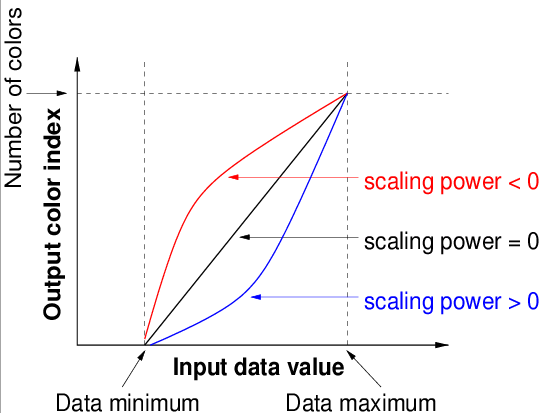
Figure 7.9: Example curves for scaling power cycles._________________________________________________________________________________________
- basic settings: colormap
You can select from a variety of colormaps here. Hot Metal, Rainbow and Greyscale colormaps are the ones most commonly used.
More information about CASA may be found at the
CASA web page
Copyright © 2010 Associated Universities Inc., Washington, D.C.
This code is available under the terms of the GNU General Public Lincense
Home |
Contact Us |
Directories |
Site Map |
Help |
Privacy Policy |
Search