 National Radio
Astronomy Observatory
|
|
|||
| NRAO Home > CASA > CASA Cookbook and User Reference Manual |
|
||
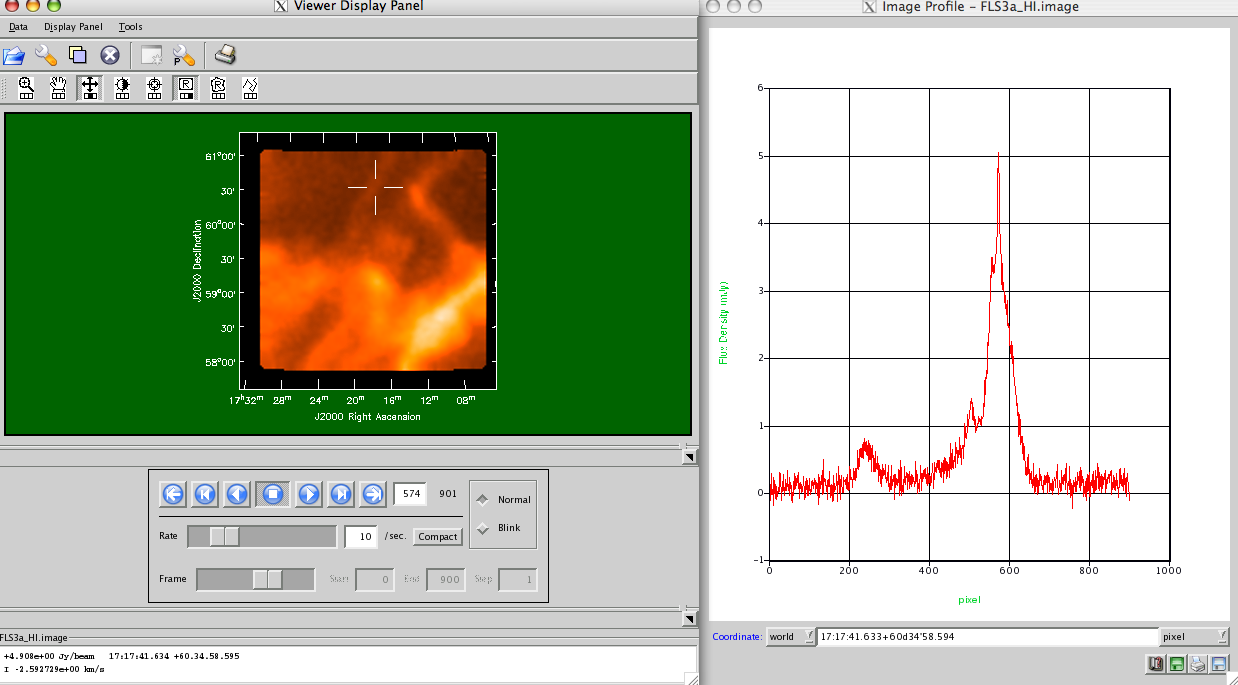
8.4.1 Single Dish Imaging Use Case With ASAP Toolkit
The data summary and and the script are given below.
# Observation: GBT(1 antennas)
#
# Telescope Observation Date Observer Project
# GBT [ 4.57539e+09, 4.5754e+09]Lockman AGBT02A_007_01
# GBT [ 4.57574e+09, 4.57575e+09]Lockman AGBT02A_007_02
# GBT [ 4.5831e+09, 4.58313e+09]Lockman AGBT02A_031_12
#
# Thu Feb 1 23:15:15 2007 NORMAL ms::summary:
# Data records: 76860 Total integration time = 7.74277e+06 seconds
# Observed from 22:05:41 to 12:51:56
#
# Thu Feb 1 23:15:15 2007 NORMAL ms::summary:
# Fields: 2
# ID Name Right Ascension Declination Epoch
# 0 FLS3a 17:18:00.00 +59.30.00.00 J2000
# 1 FLS3b 17:18:00.00 +59.30.00.00 J2000
#
# Thu Feb 1 23:15:15 2007 NORMAL ms::summary:
# Spectral Windows: (2 unique spectral windows and 1 unique polarization setups)
# SpwID #Chans Frame Ch1(MHz) Resoln(kHz) TotBW(kHz) Ref(MHz) Corrs
# 0 1024 LSRK 1421.89269 2.44140625 2500 1420.64269 XX YY
# 1 1024 LSRK 1419.39269 2.44140625 2500 1418.14269 XX YY
# FLS3 data calibration
# this is calibration part of FLS3 data
#
casapath=os.environ[’AIPSPATH’]
import asap as sd
os.environ[’AIPSPATH’]=casapath
print ’--Import--’
s=sd.scantable(’FLS3_all_newcal_SP’,false) # read in MeasurementSet
print ’--Split--’
# splitting the data for each field
s0=s.get_scan(’FLS3a*’) # split the data for the field of interest
s0.save(’FLS3a_HI.asap’) # save this scantable to disk (asap format)
del s0 # free up memory from scantable
print ’--Calibrate--’
s=sd.scantable(’FLS3a_HI.asap’) # read in scantable from disk (FLS3a)
s.set_fluxunit(’K’) # set the brightness units to Kelvin
scanns = s.getscannos() # get a list of scan numbers
sn=list(scanns) # convert it to a list
print "No. scans to be processed:", len(scanns)
res=sd.calfs(s,sn) # calibrate all scans listed using frequency
# switched calibration method
print ’--Save calibrated data--’
res.save(’FLS3a_calfs’, ’MS2’) # Save the dataset as a MeasurementSet
print ’--Image data--’
im.open(’FLS3a_calfs’) # open the data set
im.selectvis(nchan=901,start=30,step=1, # choose a subset of the data
spwid=0,field=0) # (just the key emission channels)
dir=’J2000 17:18:29 +59.31.23’ # set map center
im.defineimage(nx=150,cellx=’1.5arcmin’, # define image parameters
phasecenter=dir,mode=’channel’,start=30, # (note it assumes symmetry if ny,celly
nchan=901,step=1) # aren’t specified)
im.setoptions(ftmachine=’sd’,cache=1000000000) # choose SD gridding
im.setsdoptions(convsupport=4) # use this many pixels to support the
# gridding function used
# (default=prolate spheroidal wave function)
im.makeimage(type=’singledish’,image=’FLS3a_HI.image’) # make the image
_________________________________________________________________________________________
More information about CASA may be found at the
CASA web page
Copyright © 2010 Associated Universities Inc., Washington, D.C.
This code is available under the terms of the GNU General Public Lincense
Home |
Contact Us |
Directories |
Site Map |
Help |
Privacy Policy |
Search