|
casa
$Rev:20696$
|
|
casa
$Rev:20696$
|
Canvas for data plotting using a given plotting implementation. More...
#include <TBPlotCanvas.qo.h>
Public Slots | |
| void | clearAndHideAxes () |
| Clears all current plots and hides the two axes. | |
Signals | |
| void | regionSelected (bool selected) |
| Signal that is emitted whenever the user selects a region, or the currently selected region is cleared. | |
Public Member Functions | |
| TBPlotCanvas (PlotFactoryPtr factory) | |
| Constructor with a factory. | |
| ~TBPlotCanvas () | |
| void | setXAxisTitle (String title) |
| Sets the X-axis title to the given String. | |
| void | setYAxisTitle (String title) |
| Sets the Y-axis title to the given String. | |
| void | setShownGrids (bool xMaj, bool xMin, bool yMaj, bool yMin) |
| Sets which grids are shown on the canvas. | |
| void | setXAxisDate (bool date=true, bool mjsec=true) |
| Sets the x axis to display values as dates. | |
| void | setYAxisDate (bool date=true, bool mjsec=true) |
| Sets the y axis to display values as dates. | |
| String | getCurrentTable () |
| Returns the name of the current table being plotted. | |
| void | setTable (String table) |
| Sets the name of the current table being plotted. | |
| int | getNumPlots () |
| Returns the current number of plots currently on the canvas. | |
| vector< TBPlotData * > | allData () |
| Returns the data corresponding to the current plots. | |
| void | handleSelect (const PlotSelectEvent &event) |
| Implements PlotSelectEventHandler::handleSelect(). | |
| void | plot (TBPlotData *data, const TBPlotFormat &format, bool overplot=false) |
| Plots the given data. | |
| Result | exportToImage (String format, String location) |
| Exports the PlotCanvas to an image in the given format at the given location and returns whether the operation succeeded or not. | |
| void | clearSelectedRectangle () |
| If there is a rectangle shape from a user-selected region, clear it from the canvas. | |
| PlotRegion | currentSelection () |
| If there is a current user-selected region, return it. | |
Private Slots | |
| void | clearPlots () |
| Slot for clearing all the internal tracking of current plots. | |
Private Attributes | |
| PlotFactoryPtr | factory |
| Plotter factory. | |
| PlotterPtr | plotter |
| Plotter. | |
| PlotCanvasPtr | canvas |
| Plot canvas. | |
| String | currentTable |
| Holds the name of the current table being plotted. | |
| PlotShapeRectanglePtr | selectedRegion |
| Currently selected region, or NULL if there is none. | |
| vector< TBPlotData * > | data |
| Current data. | |
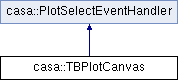
Canvas for data plotting using a given plotting implementation.
TBPlotCanvas uses and controls a plotting implementation canvas. If the implementation is Qt, it is embedded in the TBPlotCanvas; otherwise it is assumed to be in a separate window.
Definition at line 111 of file TBPlotCanvas.qo.h.
| casa::TBPlotCanvas::TBPlotCanvas | ( | PlotFactoryPtr | factory | ) |
Constructor with a factory.
| vector<TBPlotData*> casa::TBPlotCanvas::allData | ( | ) |
Returns the data corresponding to the current plots.
| void casa::TBPlotCanvas::clearAndHideAxes | ( | ) | [slot] |
Clears all current plots and hides the two axes.
| void casa::TBPlotCanvas::clearPlots | ( | ) | [private, slot] |
Slot for clearing all the internal tracking of current plots.
If there is a rectangle shape from a user-selected region, clear it from the canvas.
If there is a current user-selected region, return it.
Otherwise behavior is undefined.
| Result casa::TBPlotCanvas::exportToImage | ( | String | format, |
| String | location | ||
| ) |
Exports the PlotCanvas to an image in the given format at the given location and returns whether the operation succeeded or not.
Returns the name of the current table being plotted.
| int casa::TBPlotCanvas::getNumPlots | ( | ) |
Returns the current number of plots currently on the canvas.
| void casa::TBPlotCanvas::handleSelect | ( | const PlotSelectEvent & | event | ) | [virtual] |
Implements PlotSelectEventHandler::handleSelect().
Implements casa::PlotSelectEventHandler.
| void casa::TBPlotCanvas::plot | ( | TBPlotData * | data, |
| const TBPlotFormat & | format, | ||
| bool | overplot = false |
||
| ) |
Plots the given data.
If overplot is true all old plots are kept as well, otherwise the old plots are cleared first. See PlotCanvas::plot().
| void casa::TBPlotCanvas::regionSelected | ( | bool | selected | ) | [signal] |
Signal that is emitted whenever the user selects a region, or the currently selected region is cleared.
If selected is true, then the user selected a region and a rectangle is now on the canvas. If selected is false, then there is no longer a current selected region.
| void casa::TBPlotCanvas::setShownGrids | ( | bool | xMaj, |
| bool | xMin, | ||
| bool | yMaj, | ||
| bool | yMin | ||
| ) |
Sets which grids are shown on the canvas.
| void casa::TBPlotCanvas::setTable | ( | String | table | ) |
Sets the name of the current table being plotted.
| void casa::TBPlotCanvas::setXAxisDate | ( | bool | date = true, |
| bool | mjsec = true |
||
| ) |
Sets the x axis to display values as dates.
| void casa::TBPlotCanvas::setXAxisTitle | ( | String | title | ) |
Sets the X-axis title to the given String.
| void casa::TBPlotCanvas::setYAxisDate | ( | bool | date = true, |
| bool | mjsec = true |
||
| ) |
Sets the y axis to display values as dates.
| void casa::TBPlotCanvas::setYAxisTitle | ( | String | title | ) |
Sets the Y-axis title to the given String.
PlotCanvasPtr casa::TBPlotCanvas::canvas [private] |
Plot canvas.
Definition at line 190 of file TBPlotCanvas.qo.h.
String casa::TBPlotCanvas::currentTable [private] |
Holds the name of the current table being plotted.
Definition at line 193 of file TBPlotCanvas.qo.h.
vector<TBPlotData*> casa::TBPlotCanvas::data [private] |
Current data.
Definition at line 199 of file TBPlotCanvas.qo.h.
PlotFactoryPtr casa::TBPlotCanvas::factory [private] |
Plotter factory.
Definition at line 184 of file TBPlotCanvas.qo.h.
PlotterPtr casa::TBPlotCanvas::plotter [private] |
Definition at line 187 of file TBPlotCanvas.qo.h.
PlotShapeRectanglePtr casa::TBPlotCanvas::selectedRegion [private] |
Currently selected region, or NULL if there is none.
Definition at line 196 of file TBPlotCanvas.qo.h.
 1.8.0
1.8.0

