|
|
|||
| NRAO Home > CASA > CASA Cookbook and User Reference Manual |
|
||
3.3.1 MS Plotting and Editing using plotms
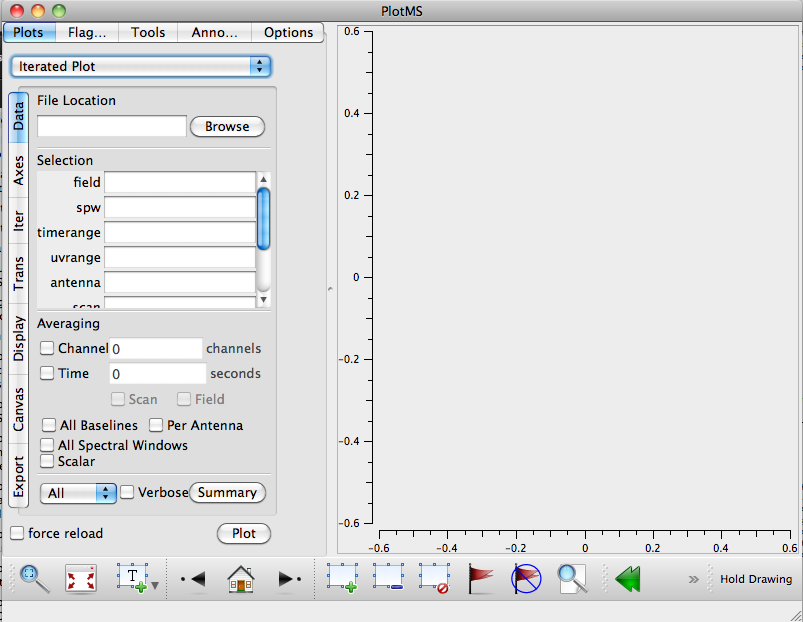
The principal way to get X-Y plots of visibility data is the plotms task. This task also provides editing capability. Plotms is a GUI-style plotter, based on Qt (http://www.trolltech.com/qt). It can either be started as a task within CASA (plotms) or from outside CASA (type casaplotms on the command line).
The current inputs to the plotms task are:
vis = ’’ # input visibility dataset (blank for none)
xaxis = ’’ # plot x-axis (blank for default/current)
yaxis = ’’ # plot y-axis (blank for default/current)
selectdata = True # data selection parameters
field = ’’ # field names or field index numbers (blank for all)
spw = ’’ # spectral windows:channels (blank for all)
timerange = ’’ # time range (blank for all)
uvrange = ’’ # uv range (blank for all)
antenna = ’’ # antenna/baselines (blank for all)
scan = ’’ # scan numbers (blank for all)
correlation = ’’ # correlations (blank for all)
array = ’’ # (sub)array numbers (blank for all)
msselect = ’’ # MS selection (blank for all)
averagedata = True # data averaging parameters
avgchannel = ’’ # average over channel? (blank = False, otherwise
# value in channels)
avgtime = ’’ # average over time? (blank = False, other value in
# seconds)
avgscan = False # only valid if time averaging is turned on. average
# over scans?
avgfield = False # only valid if time averaging is turned on. average
# over fields?
avgbaseline = False # average over all baselines? (mutually exclusive
# with avgantenna)
avgantenna = False # average by per-antenna? (mutually exclusive with
# avgbaseline)
avgspw = False # average over all spectral windows?
scalar = False # Do scalar averaging?
transform = False # transform data in various ways?
extendflag = False # have flagging extend to other data points?
iteraxis = ’’ # the axis over which to iterate
coloraxis = ’’ # selects which data to use for colorizing
plotrange = [] # plot axes ranges: [xmin,xmax,ymin,ymax]
title = ’’ # Title written along top of plot
xlabel = ’’ # Text for horizontal axis. Blank for default.
ylabel = ’’ # Text for vertical axis. Blank for default.
showmajorgrid = False # Show major grid lines (horiz and vert.)
showminorgrid = False # Show minor grid lines (horiz and vert.)
plotfile = ’’ # Name of plot file to save automatically.
async = False # If true the taskname must be started using
# plotms(...)
All of these parameters can also be set or modified from inside the plotms window. Note that, if the vis parameter is set to the name of a measurement set here, when you start up plotms, the entire measurement set will be plotted, which can be time consuming. It is probably best to leave all parameters blank for now, setting them as needed inside the plotms GUI.
3.3.1.2 A Brief Note Regarding plotms Memory Usage
3.3.1.3 Plot Axes
3.3.1.4 Tools
3.3.1.5 Interactive Flagging in plotms
3.3.1.6 Averaging Data
3.3.1.7 Plot Symbols
3.3.1.8 Summarizing Data
3.3.1.9 Defining Frequency and Velocity
3.3.1.10 Shifting the Phase Center
3.3.1.11 Plot Ranges
3.3.1.12 Plot Labels
3.3.1.13 Grid Lines
3.3.1.14 Legend
3.3.1.15 The Options Tab
3.3.1.16 Iteration
3.3.1.17 Saving your plot
3.3.1.18 Exiting plotms
More information about CASA may be found at the
CASA web page
Copyright © 2010 Associated Universities Inc., Washington, D.C.
This code is available under the terms of the GNU General Public Lincense
Home |
Contact Us |
Directories |
Site Map |
Help |
Privacy Policy |
Search

