 National Radio
Astronomy Observatory
|
|
|||
| NRAO Home > CASA > CASA Cookbook and User Reference Manual |
|
||
3.3.1.5 Interactive Flagging in plotms
Interactive flagging, on the principle of “see it — flag it”, is possible on the X-Y display of the data plotted by plotms. The user can use the cursor to mark one or more regions, and then flag, unflag, or list the data that falls in these zones of the display.
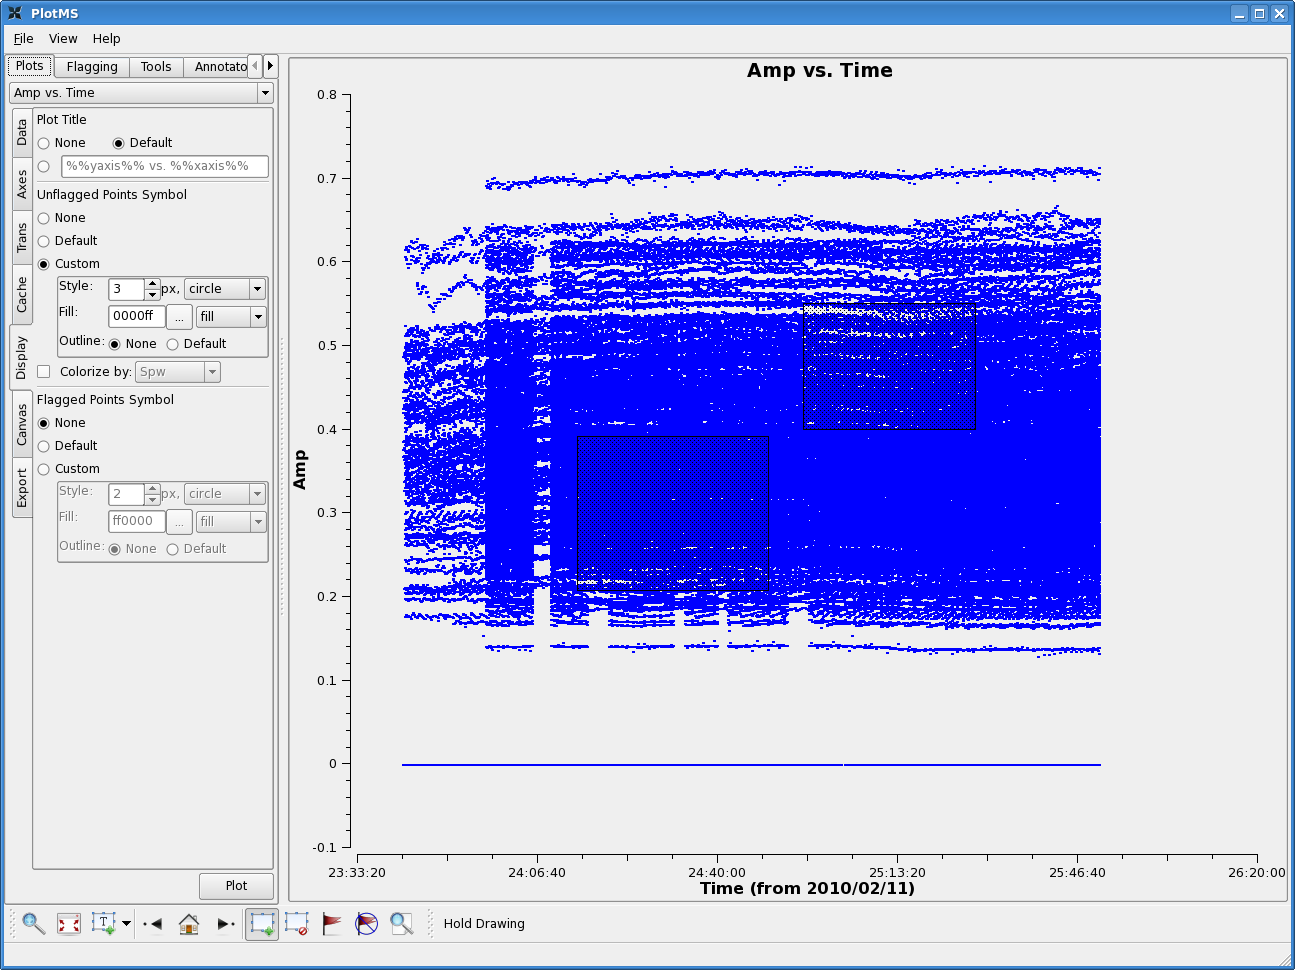
Using the row of icons buttons at the bottom of the plotms window (§ 3.3.1.4), click on the Mark Regions button (which will appear to depress), then mark a region by left-clicking and dragging the mouse (each click and drag will mark an additional region). You can get rid of all your regions by clicking on the Clear Regions. Once regions are marked, you can then click on one of the other buttons to take action:
- Flag — flag the points in the region(s),
- Unflag — unflag flagged points in the region(s),
- Locate — spew out a list of the points in the region(s) to the command line (Warning: this could be a long list!).
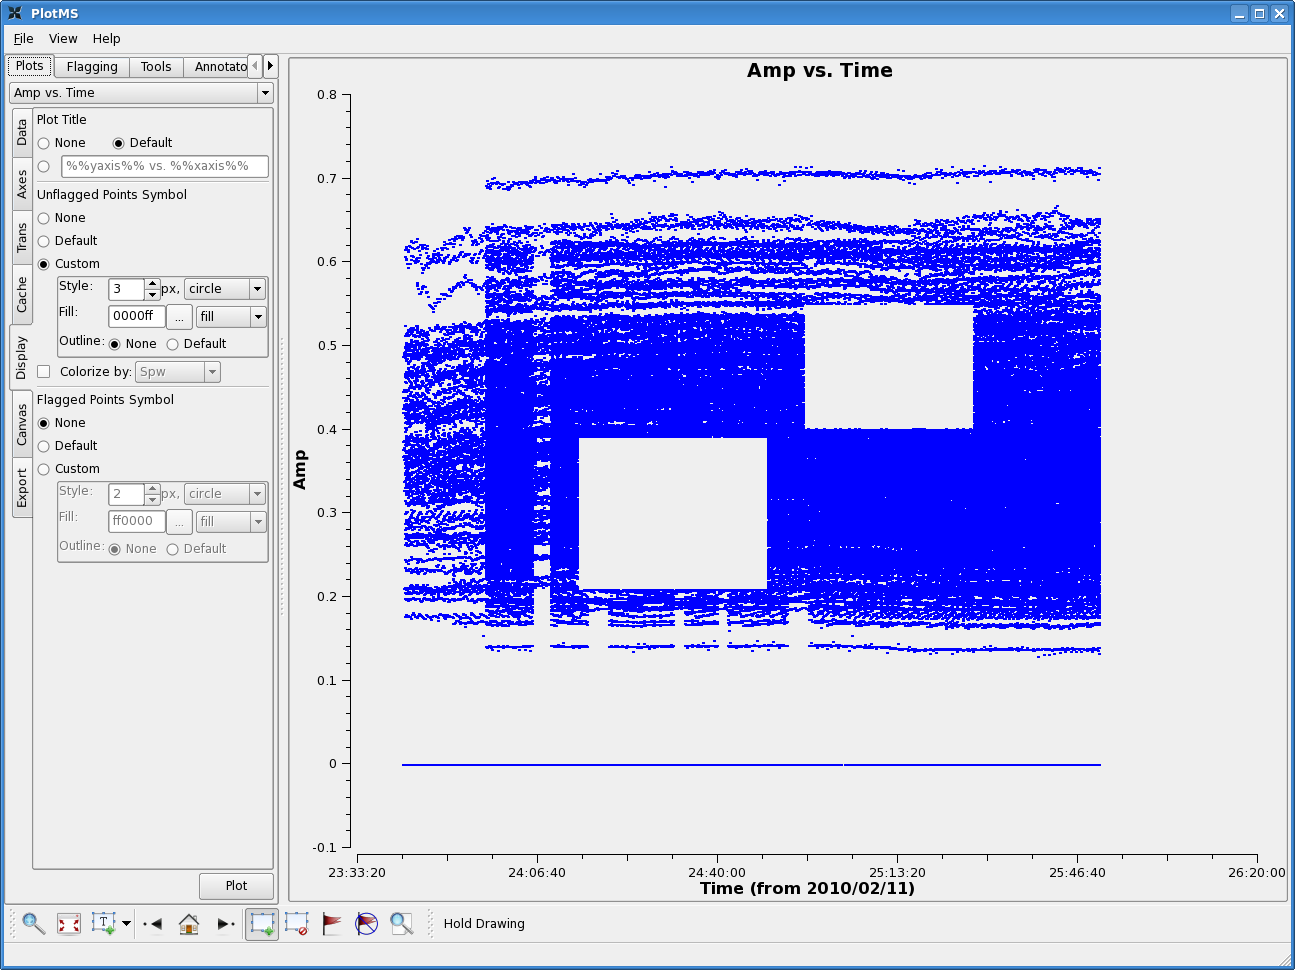
Figure 3.3 shows an example of marking regions and then clicking the Flag button. Whenever you click on a button, that action occurs without requiring an explicit disk-write. If you quit plotms and re-enter, you will see your previous edits.
_________________________________________________________________________________________
A table with the name <msname>.flagversions (where vis=<msname>) will be created in the same directory if it does not exist already. It is recommended that you save important flagging stages using the flagmanager task (§ 3.2).
Flags can also be extended with options in the Flagging tab, found near the top of the plotms window. Flag extension enables the user to plot a subset of the data and extend the flagging to a wider set. In this release, the only functional extensions are over channel and correlation.
By checking the boxes next to Extend Flags and Channel, flagging will be extended to other channels in the same spw as the displayed point. For example, if spw=’0:0’ and channel 0 is displayed, then flagging will extend to all channels in spw 0.
By checking the boxes next to Extend Flags and Correlation, flags will be extended beyond the correlations displayed. Currently the only option is to extend to All correlations, implying that all correlations will be flagged, e.g. with RR displayed, the correlations RR, RL, LR, and LL will all be flagged.
WARNING: use of flag extensions may lead to deletion of much more data than desired. Be careful!
More information about CASA may be found at the
CASA web page
Copyright © 2010 Associated Universities Inc., Washington, D.C.
This code is available under the terms of the GNU General Public Lincense
Home |
Contact Us |
Directories |
Site Map |
Help |
Privacy Policy |
Search