 National Radio
Astronomy Observatory
|
|
|||
| NRAO Home > CASA > CASA Cookbook and User Reference Manual |
|
||
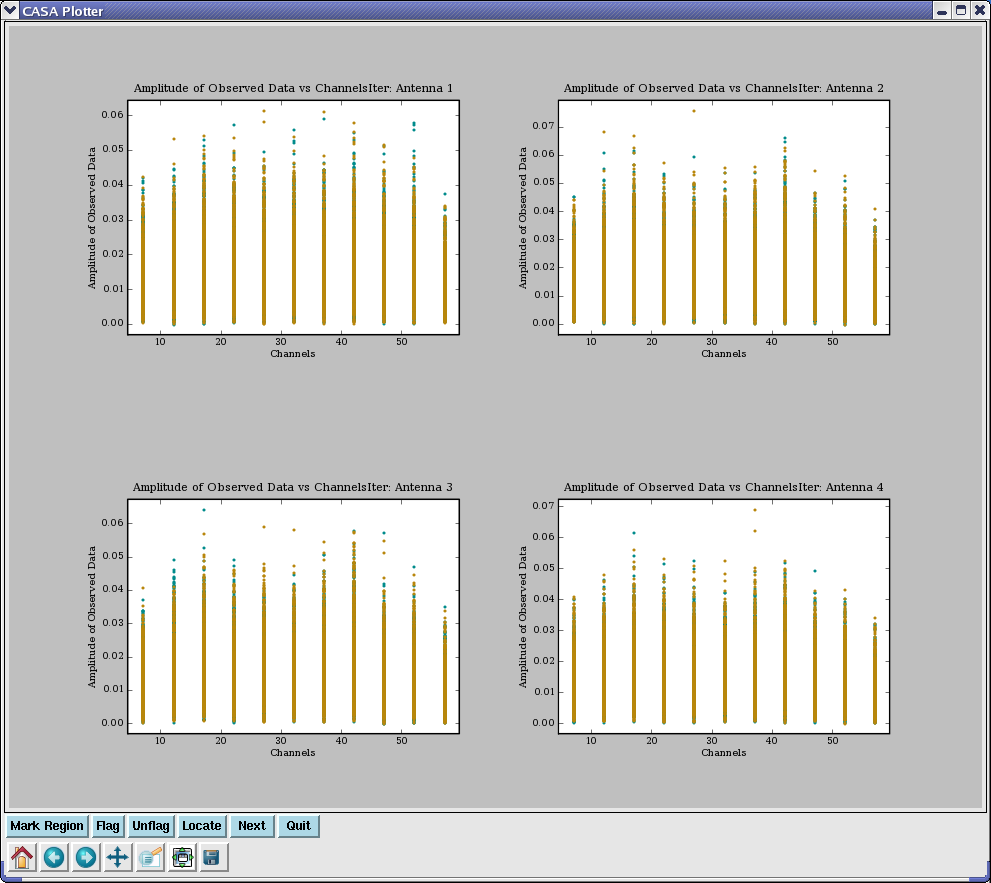
3.3.2.3 The iteration parameter
There are currently four iteration options available: ’field’, ’antenna’, and ’baseline’. If one of these options is chosen, the data will be split into separate plot displays for each value of the iteration axis (e.g., for the VLA, the ’antenna’ option will get you 27 displays, one for each antenna).
An example use of iteration:
plotxy(’n5921.ms’,’channel’,subplot=221,iteration=’antenna’,width=’5’)
The results of this are shown in Figure 3.5. Note that this example combines the use of width, iteration and subplot.
_________________________________________________________________________________________
NOTE: If you use iteration=’antenna’ or ’baseline’, be aware if you have set antenna selection. You can also control whether you see auto-correlations or not using the appropriate syntax, e.g. antenna=’*&&*’ or antenna=’*&&&’ (§ 2.3.4.1).
More information about CASA may be found at the
CASA web page
Copyright © 2010 Associated Universities Inc., Washington, D.C.
This code is available under the terms of the GNU General Public Lincense
Home |
Contact Us |
Directories |
Site Map |
Help |
Privacy Policy |
Search