 National Radio
Astronomy Observatory
|
|
|||
| NRAO Home > CASA > CASA Cookbook and User Reference Manual |
|
||
3.6.1 Flag Antenna/Channels
The following commands give the results shown in Figure 3.8:
default{’plotxy’)
plotxy(’ngc5921.ms’,’channel’,iteration=’antenna’,subplot=311)
default(’flagdata2’)
flagdata2(vis=’ngc5921.ms’,selectdata=True, manualflag=True, antenna=’0’,spw=’0:10~15’)
default plotxy
plotxy(’ngc5921.ms’,’channel’,iteration=’antenna’,subplot=311)
plotxy(’ngc5921.ms’,’channel’,iteration=’antenna’,subplot=311)
default(’flagdata2’)
flagdata2(vis=’ngc5921.ms’,selectdata=True, manualflag=True, antenna=’0’,spw=’0:10~15’)
default plotxy
plotxy(’ngc5921.ms’,’channel’,iteration=’antenna’,subplot=311)
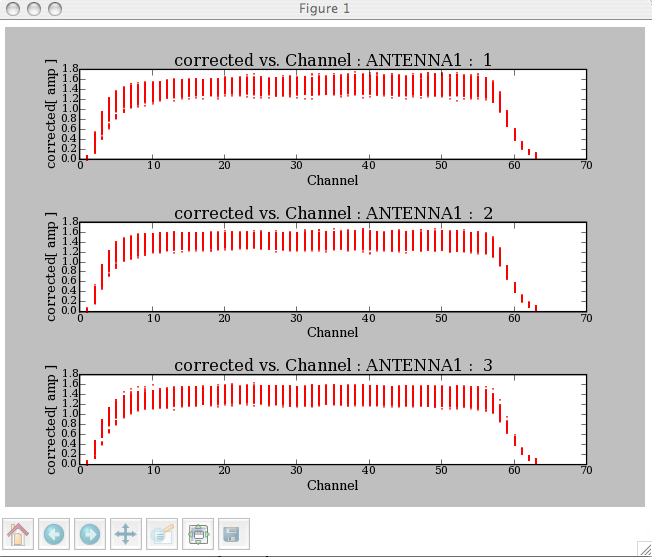
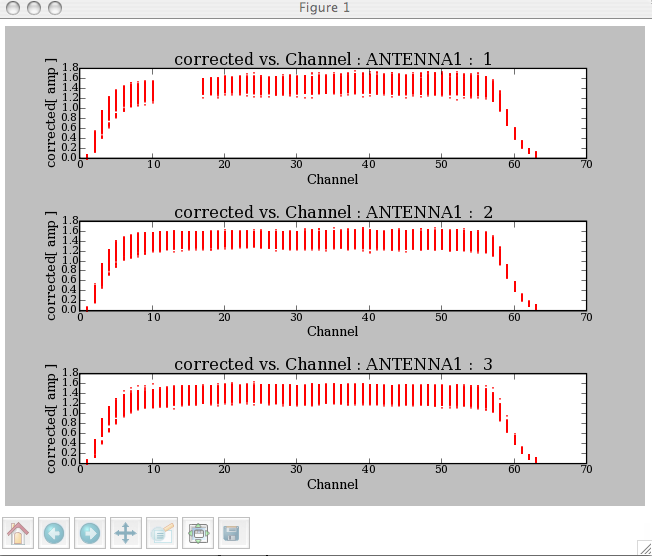
Figure 3.8: tflagdata: Example showing before and after displays using a selection of one
antenna and a range of channels. Note that each invocation of the flagdata2 task represents a
cumulative selection, i.e., running antenna=’0’ will flag all data with antenna 0, while antenna=’0’,
spw=’0:10 15’ will flag only those channels on antenna 0.
_________________________________________________________________________________________
3.6.1.1 Manual flagging and clipping in flagdata
3.6.1.2 Flagging the beginning of scans
3.6.1.3 Flagging shadowed data with mode ’shadow’
3.6.1.4 Autoflagging.
3.6.1.2 Flagging the beginning of scans
3.6.1.3 Flagging shadowed data with mode ’shadow’
3.6.1.4 Autoflagging.
More information about CASA may be found at the
CASA web page
Copyright © 2010 Associated Universities Inc., Washington, D.C.
This code is available under the terms of the GNU General Public Lincense
Home |
Contact Us |
Directories |
Site Map |
Help |
Privacy Policy |
Search