 National Radio
Astronomy Observatory
|
|
|||
| NRAO Home > CASA > CASA Cookbook and User Reference Manual |
|
||
3.6.1.1 Manual flagging and clipping in flagdata
Manualflag and clipping have been separated in flagdata2. They are controlled by separated parameters, manualflag=True and clip=True and contain there own sub-parameters:
mf_field = ’’ # Field names or field index numbers: ’’==>all,
# field=’0~2,3C286’
mf_spw = ’’ # spectral-window/frequency/channel
mf_antenna = ’’ # antenna/baselines: ’’==>all, antenna = ’3,VA04’
mf_timerange = ’’ # time range: ’’==>all, timerange=’09:14:0~09:54:0’
mf_scan = ’’ # scan numbers: ’’==>all
mf_intent = ’’ # observation intent: ’’==>all
mf_feed = ’’ # multi-feed numbers: Not yet implemented
mf_array = ’’ # (sub)array numbers: ’’==>all
mf_uvrange = ’’ # uv range: ’’==>all; uvrange = ’0~100klambda’, default
# units=meters
mf_observation = ’’ # Select data based on observation ID: ’’==>all
clip = True # Clip data according to value
clipexpr = ’ABS RR’ # Expression to clip on
clipminmax = [] # Range to use for clipping
clipcolumn = ’DATA’ # Data column to use for clipping
clipoutside = True # Clip outside the range, or within it
channelavg = False # Average over channels (scalar average)
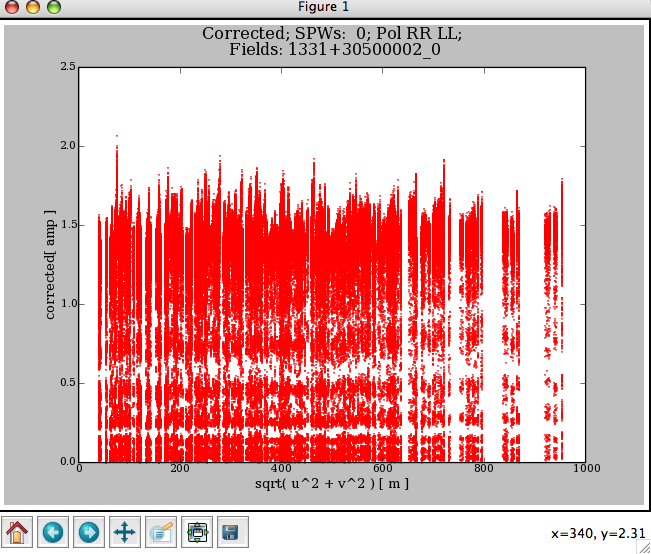
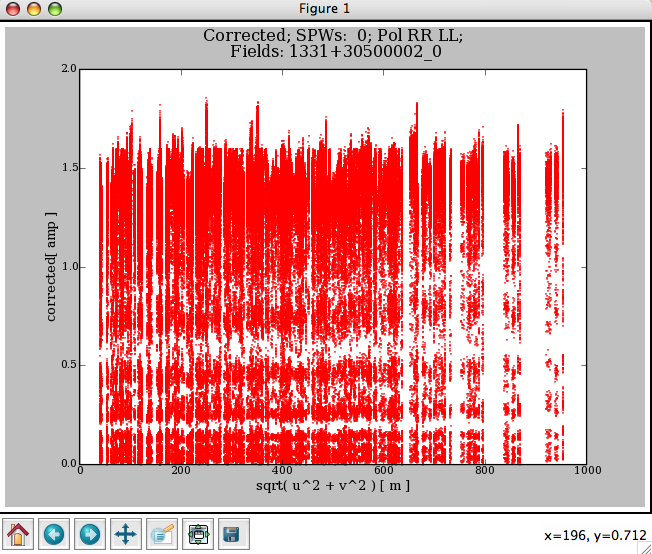
The following commands give the results shown in Figure 3.9:
flagdata2(vis=’ngc5921.ms’,clip=True, clipexpr=’LL’,clipminmax=[0.0,1.6],clipoutside=True)
plotxy(’ngc5921.ms’,’uvdist’)
_________________________________________________________________________________________
The channelavg toggle (new in Version 3.0.0) is now available to (vector) average the data over all channels before doing the clipping test. This is most useful when flagging on phase stable or corrected data (e.g. after applycal and split to a new dataset).
More information about CASA may be found at the
CASA web page
Copyright © 2010 Associated Universities Inc., Washington, D.C.
This code is available under the terms of the GNU General Public Lincense
Home |
Contact Us |
Directories |
Site Map |
Help |
Privacy Policy |
Search