|
casa
$Rev:20696$
|
|
casa
$Rev:20696$
|
Displays histograms of regions from a lattice. More...
#include <LatticeHistograms.h>
Public Member Functions | |
| LatticeHistograms (const MaskedLattice< T > &lattice, LogIO &os, Bool showProgress=True, Bool forceDisk=False) | |
Constructor takes the MaskedLattice and a LogIO object for logging. | |
| LatticeHistograms (const MaskedLattice< T > &lattice, Bool showProgress=True, Bool forceDisk=False) | |
| Constructor takes the MaskedLattice only. | |
| LatticeHistograms (const LatticeHistograms< T > &other) | |
| Copy constructor (copy semantics) | |
| virtual | ~LatticeHistograms () |
| Destructor. | |
| LatticeHistograms< T > & | operator= (const LatticeHistograms< T > &other) |
| Assignment operator (copy semantics) | |
| Bool | setAxes (const Vector< Int > &cursorAxes) |
| Set the cursor axes (0 relative). | |
| Bool | setNBins (const uInt &nBins) |
| Set the number of bins for the histogram. | |
| Bool | setIncludeRange (const Vector< T > &include) |
| Specify a pixel intensity range for which all pixels in that range are included. | |
| Bool | setGaussian (const Bool &doGauss) |
| Specify that a Gaussian overlay should be plotted on the histogram. | |
| Bool | setForm (const Bool &doLog, const Bool &doCumu) |
| Specify the form of the histogram. | |
| Bool | setStatsList (const Bool &doList) |
| This function allows you to control whether some statistics of the data that contributed to the histogram are written to the output stream. | |
| Bool | setPlotting (PGPlotter &plotter, const Vector< Int > &nxy) |
| This function sets the name of the PGPLOT plotting device and the number of subplots in x and y per page. | |
| Bool | display () |
| Display the histograms by plotting them. | |
| void | closePlotting () |
| CLose the plotter. | |
| Vector< Int > | displayAxes () const |
| Return the display axes. | |
| Bool | getHistograms (Array< T > &values, Array< T > &counts) |
This function retrieves the histograms into Array. | |
| Bool | getHistogram (Vector< T > &values, Vector< T > &counts, const IPosition &pos, const Bool posInLattice=False) |
This function retrieves the histogram at the specified location into Vectors. | |
| void | resetError () |
| Reset argument error condition. | |
| String | errorMessage () const |
| Recover last error message. | |
| Bool | setNewLattice (const MaskedLattice< T > &lattice) |
| Set a MaskedLattice. | |
Protected Member Functions | |
| IPosition | locHistInLattice (const IPosition &histPosition, Bool relativeToParent=True) const |
| Given a location in the histogram storage lattice, convert those locations on the non-histogram axis (the first one) relative to the parent or current lattice. | |
Protected Attributes | |
| LogIO | os_p |
| These things are protected only so that they are available to ImageHistograms which inherits from LatticeHistograms. | |
| Bool | goodParameterStatus_p |
| Vector< Int > | cursorAxes_p |
| Vector< Int > | displayAxes_p |
| String | error_p |
Private Types | |
| typedef NumericTraits< T > ::PrecisionType | AccumType |
| A useful typedef. | |
Private Member Functions | |
| Bool | displayHistograms () |
| Display histograms as a function of display axis. | |
| Bool | displayOneHistogram (const T &linearSum, const T &linearYMax, const IPosition &histPos, const Vector< T > &stats, const Vector< T > &values, const Vector< T > &counts, PGPlotter &plotter) |
| Display one histogram. | |
| void | extractOneHistogram (T &linearSum, T &linearYMax, Vector< T > &values, Vector< T > &counts, const Vector< T > &stats, const Vector< T > &intCounts) |
| Fish out and convert to the appropriate form one histogram from the storage lattice. | |
| Bool | generateStorageLattice () |
| Iterate through the lattice and generate the histogram accumulation lattice. | |
| void | getStatistics (Vector< T > &stats, const IPosition &pos) const |
| Get the statistics from the statistics object for the current location of either the input lattice, or the histogram storage lattice. | |
| void | listStatistics (LogIO &os, const Vector< T > &stats, T binWidth) |
| List statistics. | |
| void | makeHistograms () |
| Fill histograms storage lattice. | |
| Bool | makeStatistics () |
| Create and fill statistics object. | |
| Bool | setInclude (Vector< T > &range, Bool &noInclude, const Vector< T > &include, ostream &os) |
| Check/set include pixel range. | |
| void | setStream (ostream &os, Int oPrec) |
| Set stream attributes. | |
| virtual String | writeCoordinates (const IPosition &histPos) const |
| Make a string with pixel coordinates of display axes. | |
| Bool | writeDispAxesValues (const String &coords, PGPlotter &plotter, Float nchar) const |
| Write values of display axes on plots. | |
Static Private Member Functions | |
| static Float | convertT (const T value) |
Convert a T to a Float for plotting. | |
| static T | convertF (const Float value) |
Convert a Float (from plotting) to a T | |
Private Attributes | |
| const MaskedLattice< T > * | pInLattice_p |
| TempLattice< T > * | pStoreLattice_p |
| LatticeStatistics< T > * | pStats_p |
| Bool | binAll_p |
| Bool | needStorageLattice_p |
| Bool | doCumu_p |
| Bool | doGauss_p |
| Bool | doList_p |
| Bool | doLog_p |
| Bool | haveLogger_p |
| Bool | showProgress_p |
| Bool | forceDisk_p |
| uInt | nBins_p |
| PGPlotter | plotter_p |
| Vector< Int > | nxy_p |
| Vector< T > | range_p |
| IPosition | blcParent_p |
Displays histograms of regions from a lattice.
Public interface
This is a class designed to display histograms from MaskedLattices
This class enable you to display and/or retrieve histograms evaluated over specified regions from a MaskedLattice. The dimension of the region is arbitrary, but the size of each dimension is always the size of the corresponding lattice axis. The histograms are displayed as a function of location of the axes not used to evaluate the histograms over. The axes which you evaluate the histograms over are called the cursor axes, the others are called the display axes.
For example, consider a lattice cube (call the axes xyz or [0,1,2]). You could display histograms from xy planes (cursor axes [0,1]) as a function of z (display axes [2]). Or you could retrieve histograms from the z axis (cursor axes [2]) for each [x,y] location (display axes [0,1]).
This class generates a "storage lattice" into which it writes the histograms. It is from this storage lattice that the plotting and retrieval arrays are drawn. The storage lattice is either in core or on disk depending upon its size (if > 10% of memory given by .aipsrc system.resources.memory then it goes into a disk-based PagedArray). If on disk, the storage lattice is deleted when the LatticeHistograms object destructs.
Tip: Note that for complex lattices, real and imaginary are treated independently; They are binned and plotted separately;
Tip: If you ignore return error statuses from the functions that set the state of the class, the internal status of the class is set to bad; This means it will just keep on returning error conditions until you explicitly recover the situation; A message describing the last error condition can be recovered with function errorMessage;
   // Construct PagedImage from file name

         PagedImage<Float> inImage(inName);

   // Construct histogram object

         LogOrigin or("myClass", "myFunction(...)", WHERE);
         LogIO os(or);
         ImageHistograms<Float> histo(inImage, os);

   // Set cursor axes to see statistics of yz planes (0 relative)

         Vector<Int> cursorAxes(2)
         cursorAxes(0) = 1;
         cursorAxes(1) = 2;
         if (!histo.setAxes(cursorAxes)) return 1;

   // Set to list and plot mean, sigma and rms

         if (!histo.setList(True)) return 1;
         String device = "/xs";
         Vector<Int> nxy(2);
         nxy(0) = 3;
         nxy(1) = 3;
         if (!histo.setPlotting(device, nxy)) return 1;

   // Now activate actual listing and plotting

         if (!histo.display ()) return 1;

   // Retrieve histograms into array

         Array<Float> values, counts;
         if (!histo.getHistograms(values, counts)) return 1;
In this example, a PagedImage is constructed. We set the cursor axes to be the y and z axes so we make a histogram of each yz plane as a function of x location on the PGPLOT device "/xs" with 9 subplots per page. After the plotting we also retrieve the histograms into an array.
The generation of histograms from an image is a basic and necessary capability.
Definition at line 158 of file LatticeHistograms.h.
typedef NumericTraits<T>::PrecisionType casa::LatticeHistograms< T >::AccumType [private] |
A useful typedef.
Definition at line 305 of file LatticeHistograms.h.
| casa::LatticeHistograms< T >::LatticeHistograms | ( | const MaskedLattice< T > & | lattice, |
| LogIO & | os, | ||
| Bool | showProgress = True, |
||
| Bool | forceDisk = False |
||
| ) |
Constructor takes the MaskedLattice and a LogIO object for logging.
You can also specify whether you want to see progress meters or not. You can force the storage lattice to be disk based, otherwise the decision for core or disk is taken for you.
| casa::LatticeHistograms< T >::LatticeHistograms | ( | const MaskedLattice< T > & | lattice, |
| Bool | showProgress = True, |
||
| Bool | forceDisk = False |
||
| ) |
Constructor takes the MaskedLattice only.
In the absence of a logger you get no messages. This includes error messages and potential listing of statistics. You can specify whether you want to see progress meters or not. You can force the storage lattice to be disk based, otherwise the decision for core or disk is taken for you.
| casa::LatticeHistograms< T >::LatticeHistograms | ( | const LatticeHistograms< T > & | other | ) |
Copy constructor (copy semantics)
| virtual casa::LatticeHistograms< T >::~LatticeHistograms | ( | ) | [virtual] |
Destructor.
| void casa::LatticeHistograms< T >::closePlotting | ( | ) |
CLose the plotter.
| static T casa::LatticeHistograms< T >::convertF | ( | const Float | value | ) | [inline, static, private] |
Convert a Float (from plotting) to a T
Definition at line 324 of file LatticeHistograms.h.
| static Float casa::LatticeHistograms< T >::convertT | ( | const T | value | ) | [inline, static, private] |
Convert a T to a Float for plotting.
Definition at line 321 of file LatticeHistograms.h.
| Bool casa::LatticeHistograms< T >::display | ( | ) |
Display the histograms by plotting them.
A return value of False indicates an invalid plotting device, or that the internal status of the class is bad. If you don't call this function you won't see any histograms.
| Vector<Int> casa::LatticeHistograms< T >::displayAxes | ( | ) | const [inline] |
Return the display axes.
Definition at line 250 of file LatticeHistograms.h.
| Bool casa::LatticeHistograms< T >::displayHistograms | ( | ) | [private] |
Display histograms as a function of display axis.
| Bool casa::LatticeHistograms< T >::displayOneHistogram | ( | const T & | linearSum, |
| const T & | linearYMax, | ||
| const IPosition & | histPos, | ||
| const Vector< T > & | stats, | ||
| const Vector< T > & | values, | ||
| const Vector< T > & | counts, | ||
| PGPlotter & | plotter | ||
| ) | [private] |
Display one histogram.
| String casa::LatticeHistograms< T >::errorMessage | ( | ) | const [inline] |
Recover last error message.
Definition at line 282 of file LatticeHistograms.h.
| void casa::LatticeHistograms< T >::extractOneHistogram | ( | T & | linearSum, |
| T & | linearYMax, | ||
| Vector< T > & | values, | ||
| Vector< T > & | counts, | ||
| const Vector< T > & | stats, | ||
| const Vector< T > & | intCounts | ||
| ) | [private] |
Fish out and convert to the appropriate form one histogram from the storage lattice.
| Bool casa::LatticeHistograms< T >::generateStorageLattice | ( | ) | [private] |
Iterate through the lattice and generate the histogram accumulation lattice.
| Bool casa::LatticeHistograms< T >::getHistogram | ( | Vector< T > & | values, |
| Vector< T > & | counts, | ||
| const IPosition & | pos, | ||
| const Bool | posInLattice = False |
||
| ) |
This function retrieves the histogram at the specified location into Vectors.
The histogram is retrieved in the form specified by the setForm function. The vectors are resized internally. If posInLattice=True then the location is a location in the input lattice. Any positions on the display axes are ignored. Otherwise, you should just give locations for the display axes only. A return value of False indicates that the internal status of the class is bad.
| Bool casa::LatticeHistograms< T >::getHistograms | ( | Array< T > & | values, |
| Array< T > & | counts | ||
| ) |
This function retrieves the histograms into Array.
The shape of the first dimension of this array is the number of bins. The rest of the shape of the array is the shape of the display axes (e.g. if the shape of the lattice is [nx,ny,nz] and you ask for histograms of the y axis the shape of the returned array would be [nbins,nx,nz]. The histograms are retrieved in the form specified by the setForm function. The arrays are resized internally. A return value of False indicates that the internal status of the class is bad.
| void casa::LatticeHistograms< T >::getStatistics | ( | Vector< T > & | stats, |
| const IPosition & | pos | ||
| ) | const [private] |
Get the statistics from the statistics object for the current location of either the input lattice, or the histogram storage lattice.
| void casa::LatticeHistograms< T >::listStatistics | ( | LogIO & | os, |
| const Vector< T > & | stats, | ||
| T | binWidth | ||
| ) | [private] |
List statistics.
| IPosition casa::LatticeHistograms< T >::locHistInLattice | ( | const IPosition & | histPosition, |
| Bool | relativeToParent = True |
||
| ) | const [protected] |
Given a location in the histogram storage lattice, convert those locations on the non-histogram axis (the first one) relative to the parent or current lattice.
| void casa::LatticeHistograms< T >::makeHistograms | ( | ) | [private] |
Fill histograms storage lattice.
| Bool casa::LatticeHistograms< T >::makeStatistics | ( | ) | [private] |
Create and fill statistics object.
| LatticeHistograms<T>& casa::LatticeHistograms< T >::operator= | ( | const LatticeHistograms< T > & | other | ) |
Assignment operator (copy semantics)
| void casa::LatticeHistograms< T >::resetError | ( | ) | [inline] |
Reset argument error condition.
If you specify invalid arguments to one of the above set functions, an internal flag will be set which will prevent the work functions from doing anything (should you have chosen to ignore the Boolean return values of the set functions). This function allows you to reset that internal state to good.
Definition at line 279 of file LatticeHistograms.h.
| Bool casa::LatticeHistograms< T >::setAxes | ( | const Vector< Int > & | cursorAxes | ) |
Set the cursor axes (0 relative).
A return value of False indicates you have asked for an invalid axis or that the internal status of the class is bad. The default state of the class is to set the cursor axes to all axes in the lattice.
| Bool casa::LatticeHistograms< T >::setForm | ( | const Bool & | doLog, |
| const Bool & | doCumu | ||
| ) |
Specify the form of the histogram.
It can be plotted linearly or logarithmically, and cumulatively or non-cumulatively. A return value of False indicates that the internal status of the class is bad. The default state of the class is to draw the histograms linearly and non-cumulatively.
| Bool casa::LatticeHistograms< T >::setGaussian | ( | const Bool & | doGauss | ) |
Specify that a Gaussian overlay should be plotted on the histogram.
This Gaussian has the same mean and standard deviation as the data that were binned, and the same integral as the histogram. A return value of False indicates that the internal status of the class is bad. The default state of the class is to not draw a Gaussian overlay.
| Bool casa::LatticeHistograms< T >::setInclude | ( | Vector< T > & | range, |
| Bool & | noInclude, | ||
| const Vector< T > & | include, | ||
| ostream & | os | ||
| ) | [private] |
Check/set include pixel range.
| Bool casa::LatticeHistograms< T >::setIncludeRange | ( | const Vector< T > & | include | ) |
Specify a pixel intensity range for which all pixels in that range are included.
A vector of length 1 for include means that the range will be set to -abs(include(0)) to abs(include(0)). A return value of False indicates that the internal status of the class is bad. If you don't call this function, the default state of the class is to include all pixels.
| Bool casa::LatticeHistograms< T >::setNBins | ( | const uInt & | nBins | ) |
Set the number of bins for the histogram.
Note that the bin width is worked out for each histogram separately from the data minimum and maximum. The default state of the class is to set 25 bins. A return value of False indicates you gave a non-positive bin width or that the internal status of the class is bad.
| Bool casa::LatticeHistograms< T >::setNewLattice | ( | const MaskedLattice< T > & | lattice | ) |
Set a MaskedLattice.
A return value of False indicates the lattice had an invalid type or that the internal status of the class is bad.
| Bool casa::LatticeHistograms< T >::setPlotting | ( | PGPlotter & | plotter, |
| const Vector< Int > & | nxy | ||
| ) |
This function sets the name of the PGPLOT plotting device and the number of subplots in x and y per page.
If you set plotter but offer a zero length array for nxy then nxy is set to [1,1]. A return value of False indicates invalid plotting arguments or that the internal status of the class is bad. If you don't call this function, the default state of the class is to not set a plotting device.
| Bool casa::LatticeHistograms< T >::setStatsList | ( | const Bool & | doList | ) |
This function allows you to control whether some statistics of the data that contributed to the histogram are written to the output stream.
A return value of False indicates that the internal status of the class is bad. The default state of the class is to not list statistics.
| void casa::LatticeHistograms< T >::setStream | ( | ostream & | os, |
| Int | oPrec | ||
| ) | [private] |
Set stream attributes.
| virtual String casa::LatticeHistograms< T >::writeCoordinates | ( | const IPosition & | histPos | ) | const [private, virtual] |
Make a string with pixel coordinates of display axes.
This function is over-ridden by ImageHistograms which inherits from LatticeHistograms.
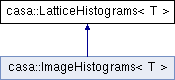
Reimplemented in casa::ImageHistograms< T >.
| Bool casa::LatticeHistograms< T >::writeDispAxesValues | ( | const String & | coords, |
| PGPlotter & | plotter, | ||
| Float | nchar | ||
| ) | const [private] |
Write values of display axes on plots.
Bool casa::LatticeHistograms< T >::binAll_p [private] |
Definition at line 310 of file LatticeHistograms.h.
IPosition casa::LatticeHistograms< T >::blcParent_p [private] |
Definition at line 317 of file LatticeHistograms.h.
Vector<Int> casa::LatticeHistograms< T >::cursorAxes_p [protected] |
Definition at line 294 of file LatticeHistograms.h.
Vector<Int> casa::LatticeHistograms< T >::displayAxes_p [protected] |
Definition at line 294 of file LatticeHistograms.h.
Referenced by casa::LatticeHistograms< Float >::displayAxes().
Bool casa::LatticeHistograms< T >::doCumu_p [private] |
Definition at line 311 of file LatticeHistograms.h.
Bool casa::LatticeHistograms< T >::doGauss_p [private] |
Definition at line 311 of file LatticeHistograms.h.
Bool casa::LatticeHistograms< T >::doList_p [private] |
Definition at line 311 of file LatticeHistograms.h.
Bool casa::LatticeHistograms< T >::doLog_p [private] |
Definition at line 311 of file LatticeHistograms.h.
String casa::LatticeHistograms< T >::error_p [protected] |
Definition at line 295 of file LatticeHistograms.h.
Referenced by casa::LatticeHistograms< Float >::errorMessage().
Bool casa::LatticeHistograms< T >::forceDisk_p [private] |
Definition at line 312 of file LatticeHistograms.h.
Bool casa::LatticeHistograms< T >::goodParameterStatus_p [protected] |
Definition at line 293 of file LatticeHistograms.h.
Referenced by casa::LatticeHistograms< Float >::resetError().
Bool casa::LatticeHistograms< T >::haveLogger_p [private] |
Definition at line 312 of file LatticeHistograms.h.
uInt casa::LatticeHistograms< T >::nBins_p [private] |
Definition at line 313 of file LatticeHistograms.h.
Bool casa::LatticeHistograms< T >::needStorageLattice_p [private] |
Definition at line 310 of file LatticeHistograms.h.
Vector<Int> casa::LatticeHistograms< T >::nxy_p [private] |
Definition at line 315 of file LatticeHistograms.h.
LogIO casa::LatticeHistograms< T >::os_p [protected] |
These things are protected only so that they are available to ImageHistograms which inherits from LatticeHistograms.
Reimplemented in casa::ImageHistograms< T >.
Definition at line 292 of file LatticeHistograms.h.
const MaskedLattice<T>* casa::LatticeHistograms< T >::pInLattice_p [private] |
Definition at line 307 of file LatticeHistograms.h.
PGPlotter casa::LatticeHistograms< T >::plotter_p [private] |
Definition at line 314 of file LatticeHistograms.h.
LatticeStatistics<T>* casa::LatticeHistograms< T >::pStats_p [private] |
Definition at line 309 of file LatticeHistograms.h.
TempLattice<T>* casa::LatticeHistograms< T >::pStoreLattice_p [private] |
Definition at line 308 of file LatticeHistograms.h.
Vector<T> casa::LatticeHistograms< T >::range_p [private] |
Definition at line 316 of file LatticeHistograms.h.
Bool casa::LatticeHistograms< T >::showProgress_p [private] |
Definition at line 312 of file LatticeHistograms.h.
 1.8.0
1.8.0

