 National Radio
Astronomy Observatory
|
|
|||
| NRAO Home > CASA > CASA Cookbook and User Reference Manual |
|
||
8.2 Single Dish Analysis Tasks
A set of single dish tasks is available for simplifying basic reduction activities. The list currently includes:
- sdcal — select, calibrate, and average SD data
- sdsmooth — smooth SD spectra
- sdbaseline — fit/remove spectral baselines from SD data
- sdreduce — sdcal, sdsmooth, and sdbaseline combined to perform standard single dish processing all at once
- sdcoadd — merge/co-add multiple SD data
- sdflag — channel/row flagging of SD spectra
- sdflagmanager — enable list, save, restore, delete and rename flag version files
- sdfit — line fitting to SD spectra
- sdgrid — convolve map data onto regularly spaced grid
- sdimaging — create an image from the total power or spectral data
- sdimprocess — remove the ’scanning noise’ from raster scanned image
- sdlist — print a summary of a SD dataset
- sdmath — do simple arithmetic for SD spectra
- sdplot — plotting of SD spectra, including overlay of line catalog data
- sdsave — save SD data to different format
- sdscale — scale SD data
- sdstat — compute statistics of regions of SD spectra
- sdtpimaging — do a simple calibration and create an image from the total power raster scans
- msmoments — compute moments from spectral data
All of the SDtasks, except those related to imaging (sdtpimaging, sdimaging, and sdimprocess), work from a file on disk rather than from a scantable in memory as the ASAP toolkit does (see § 8.3). Inside the tasks we invoke a call to sd.scantable to read the data. The scantable objects do not persist within CASA after completion of the tasks and are destroyed to free up memory.
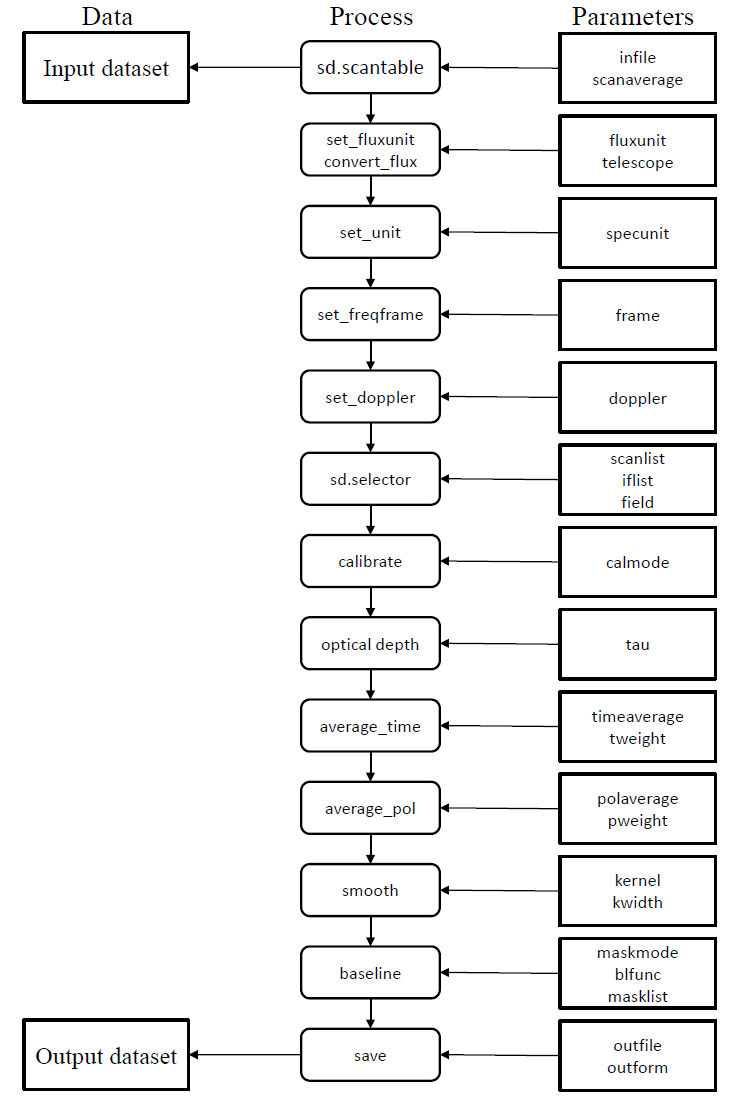
Three tasks sdcal, sdsmooth, and sdbaseline are the workhorses for the calibration, selection, averaging, baseline fitting, and smoothing. The output datasets for each task are written to a file on disk. Alternatively, one can use the task sdreduce to perform all of the steps in the three tasks described. Its operation is controlled by three main ”mode” parameters: calmode (which selects the type of calibration, if any, to be applied), kernel (which selects the smoothing), and blfunc (which selects baseline fitting). There are also parameters controlling the selection such as scanlist, iflist, field, scanaverage, timeaverage, and polaverage. Note that sdreduce can be run with calmode=’none’ to allow re-selection or writing out of data that is already calibrated. There is a ”wiring diagram” of the dataflow and control inputs for sdreduce shown in Figure 8.1.
_________________________________________________________________________________________
The SDtasks support the import and export file formats supported by ASAP itself. For import, this includes: ASAP (scantables), MS (CASA Measurement Set), RPFITS, SDFITS (version 1.3) and NRO data format. For export, this includes: ASAP (scantables), MS (CASA Measurement Set), ASCII (text file), SDFITS (a flavor of SD FITS). The sdsave task is available exclusively for exporting with these data selection options. The sdcoadd task is available to merge data in separate data files into one. A brief summary of the data in a file is found in the sdlist task help.
Plotting of spectra is handled in the sdplot task. It also offers some selection, averaging, and smoothing options in case you are working from a dataset that has not been split or averaged. Note that there is some rudimentary plotting capability in many of SDtasks, controlled through the plotlevel parameter, to aid in the assessment of the performance of these tasks.
Scaling of the spectra and Tsys is available in the sdscale. For arithmetic operations of spectra in separate scantables, sdmath has been added.
Calculation of statistics on spectral regions is available in the sdstat task. Results are passed by a Python dictionary return variable. The statistics of spectra can also be calculated via msmoments task. The input of msmoments task must be in CASA Measurement Set format. The task newly creates Measurement Set to store statistics values.
Basic Gaussian line-fitting is handled by the sdfit task. It can deal with the simpler cases, and offers some automation as well as interactive selection of fitting region, but more complicated fitting is best accomplished through the toolkit (sd.fitter).
Basic interactive and non-interactive channel and row flagging are available in the sdflag task. The flags in the input file is updated by default, i.e., outfile=’’ and overwrite=True. Otherwise, a new file is created to store dataset with updated flag infromation.
Limited total power data analysis functionality is available through the task sdtpimaging. A single dish image data cube can be created using sdimaging, which also handles total power imaging. These tasks directly access the Measurement Set without converting it to scantable format. The sdimprocess is intended to remove the ’scanning noise’ from single dish images by either the ’Basket-Weaving’ or ’Pressed-out’ methods.
The task sdgrid, which convolves map data onto regularly spaced grid, is available. The task can be used as imaging tool although output of this task is not an image but a scantable. Also, it can be regarded as a data averaging tool with various weight.
Although the Measurement Set can store data from multiple antennas even if it consists of only single-dish spectra (auto-correlation data), the scantable cannot distinguish data from multiple antennas. It causes a problem when the user processes the Measurement Set using SDtasks. Therefore, id or name of the antenna that the user want to process must be explicitly specified if the input dataset for SDtasks is Measurement Set. This can be done by antenna parameter. By default (antenna=0), data associate with antenna id 0 is imported. The antenna parameter takes no effect for other input data formats.
8.2.1.1 sdcal
8.2.1.2 sdsmooth
8.2.1.3 sdbaseline
8.2.1.4 sdreduce
8.2.1.5 sdcoadd
8.2.1.6 sdflag
8.2.1.7 sdflagmanager
8.2.1.8 sdfit
8.2.1.9 sdgrid
8.2.1.10 sdimaging
8.2.1.11 sdlist
8.2.1.12 sdmath
8.2.1.13 sdplot
8.2.1.14 sdsave
8.2.1.15 sdscale
8.2.1.16 sdstat
8.2.1.17 sdtpimaging
8.2.1.18 sdimprocess
8.2.1.19 msmoments
8.2.2 Single Dish Analysis Use Cases With SDTasks
8.2.2.1 GBT Position Switched Data Analysis
8.2.2.2 Imaging of Total Power Raster Scans
More information about CASA may be found at the
CASA web page
Copyright © 2010 Associated Universities Inc., Washington, D.C.
This code is available under the terms of the GNU General Public Lincense
Home |
Contact Us |
Directories |
Site Map |
Help |
Privacy Policy |
Search