 National Radio
Astronomy Observatory
|
|
|||
| NRAO Home > CASA > CASA Cookbook and User Reference Manual |
|
||
8.2.1.6 sdflag
infile -- name of input SD dataset
antenna -- antenna name or id (only effective for MS input).
scanlist -- list of scan numbers to process
default: [] (use all scans)
example: [21,22,23,24]
this selection is in addition to field
and iflist
field -- selection string for selecting scans by name
default: ’’ (no name selection)
example: ’FLS3a*’
this selection is in addition to scanlist, iflist, and pollist
iflist -- list of IF id numbers to select
default: [] (use all IFs)
example: [15]
this selection is in addition to scanlist, field, and pollist
pollist -- list of polarization id numbers to select
default: [] (use all polarizations)
example: [1]
this selection is in addition to scanlist, field, and iflist
maskflag -- list of mask regions to apply flag/unflag
Note, this parameter is ignored if one or more rows are
given in flagrow, or clip=True.
default: [] (entire spectrum)
example: [[1000,3000],[5000,7000]]
flagrow -- list of row numbers to apply flag/unflag
Note, this parameter is effective only when one or more row
numbers are given explicitly and also clip=False
default: [] (no row selection)
example: [0, 2, 3]
clip -- flag data that are outside a specified range
options: (bool)True,False
default: False
>>> clip expandable parameters
clipminmax -- range of data that will NOT be flagged
default: [] means do not use clip option
example: [0.0,1.5]
clipoutside -- clip OUTSIDE the range ?
options: (bool)True,False
default: True
example: clipoutside=False means flag data WITHIN the range.
flagmode -- flag mode
default: ’flag’
options: ’flag’,’unflag’
interactive -- determines interactive flagging
options: (bool) True,False
default: False
outfile -- Name of output file
default: ’’
Note: by default (outfile=’’), actual output file name is set as follows:
(1) if overwrite=True (default), infile (input) will be overwritten.
WARNING: If the formats of input and ouput files are different,
this causes complete loss of input file.
(2) if overwrite=False, outfile will be <infile>_f.
outform -- format of output file
options: ’ASCII’,’SDFITS’,’MS’,’ASAP’
default: ’ASAP’
example: the ASAP format is easiest for further sd
processing; use MS for CASA imaging.
WARNING: Be sure outform is same as the input file format when you
overwrite the input file by overwrite=True and outfile=’’ (default).
overwrite -- overwrite the output file if already exists
options: (bool) True,False
default: True
WARNING: input file is overwritten if overwrite=True and outfile=’’ (default).
This causes the complete loss of input file if the formats of
input and ouput files are different.
plotlevel -- control for plotting of results
options: (int) 0=none, 1=some, 2=more, <0=hardcopy
default: 0 (no plotting)
example: plotlevel<0 as abs(plotlevel), e.g.
-1 => hardcopy of final plot (will be named
<outfile>_flag.eps)
WARNING: be careful plotting in fsotf mode!
DESCRIPTION:
Task sdflag performs both interactive and non-interactive channel/row based flagging on spectra. Currently, the available ways of non-interactive flagging include: (1) channel based flagging by specifying a range of spectral values with clip=True, (2) row based flagging by specifying a list of row numbers to the flagrow parameter, and (3) channel based flagging by specifying regions in channel to the maskflag parameter. These three ways of flagging can not be executed simultaneously. If more than one parameter above are specified, the task looks for them in the above order and operates the first specified way of flagging operation.
Interactive flagging is available when interactive=True. The available ways of interactive flagging include: (1) row based flagging by selecting ’panel’ and (2) channel based flagging by selecting ’region’s of channels on Flag plotter. Note that the Flag plotter is loaded after carrying out the non-interactive flag operation if any specified. See the following instruction for details of how to select channel regions and spectra on the plotter.
If plotlevel ≥ 1, the task asks you if you really apply the flags before it is actually written to the data with a plot indicating flagged regions. Please note that this task is still experimental.
WARNING for overwrite option:
Be sure outform is the same as data format of input file when you overwrite it. Since CASA 3.1, the
default value of the option overwrite has been changed to True, thereby the current dataset
(infile) is overwritten unless a different file name is set to outfile. There is a known issue in
overwriting infile. If outform differs to the data format of infile, the data is overwritten
with the new data format (specified by outform) and the data in the original format will be
lost.
See the sdcal description for note on GBT raw SDFITS format data.
Interactive flag operations on the Flag plotter
When sdflag is executed with interactive=True, interactive flag operation is available on a plotter, Flag Plotter, as shown in Figure 8.2. Flag Plotter uses the matplotlib plotting library to display its plots. You can find information on matplotlib at http://matplotlib.sourceforge.net/. Note the plotter is loaded after non-interactive flag operation, if any of maskflag, flagrow, or clip is specified.
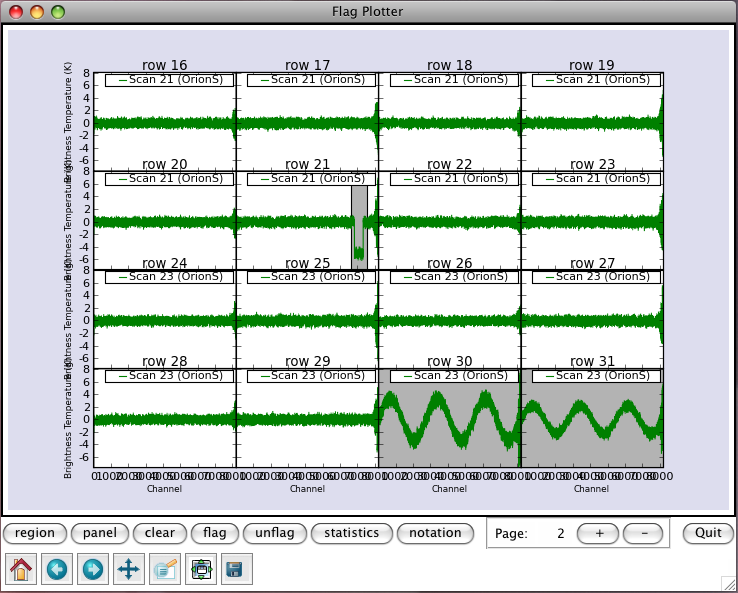
_________________________________________________________________________________________
The Flag Plotter has two rows of buttons at the bottom to control its operation – in particular, to determine flagging and unflagging behaviors. When no button in the toolbar is depressed, the Flag Plotter is in spectral value mode. Click on a spectrum to select it and drag the mouse to print the spectral value at the channel position of mouse. The value is printed to the bottom right corner of plotter window.
The buttons on the lower row are the standard matplotlib navigation buttons. See § 3.3.2.1 about details of their capabilities.
In a row above it, there are a set of the other buttons (left to right):
- region — If depressed lets you mark channel regions in the panels. This is done by left-clicking the mouse twice at start and end channels of a region to mark. The marked regions are indicated with gray boxes. Clicking the button again will un-depress it and go back to the default spectral value mode. You can Mark multiple regions before doing something.
- panel — If depressed lets you mark spectra in the panels. This is done by left-clicking the mouse on panels you want to mark the whole spectrum. The marked panels are colored in gray. Clicking the button again will un-depress it and go back to the default spectral value mode. You can Mark multiple spectra before doing something.
- clear — Click this to forget marked regions and spectra.
- flag — Click this to Flag the points in marked regions and spectra.
- unflag — Click this to Unflag any flagged point that would be in marked regions and spectra (even if invisible).
- statistics — Click this to print out statics of marked regions and spectra to the logger.
- notation — If depressed lets you edit texts on the plotter. Clicking the button again will un-depress it and go back to the default spectral value mode. See § 8.2.1.13 for details.
- + and - — Step to the next or previous plot in an iteration. The page counter on their left shows the current page number.
- Quit — Click this to close Flag Plotter.
To operate flagging and unflagging interactively, press region button (which will appear to depress), then mark channel regions by left-clicking the mouse at start and end channels of the region (each selection will add an additional region), and/or press panel button (which will appear to depress), then mark spectra by left-clicking on their panels (each selection will add an additional spectrum). You can get rid of all your regions and spectra by clicking clear button. Once regions and spectra are marked, click on one of flag, unflag, and statistics button to take the action.
More information about CASA may be found at the
CASA web page
Copyright © 2010 Associated Universities Inc., Washington, D.C.
This code is available under the terms of the GNU General Public Lincense
Home |
Contact Us |
Directories |
Site Map |
Help |
Privacy Policy |
Search