 National Radio
Astronomy Observatory
|
|
|||
| NRAO Home > CASA > CASA Cookbook and User Reference Manual |
|
||
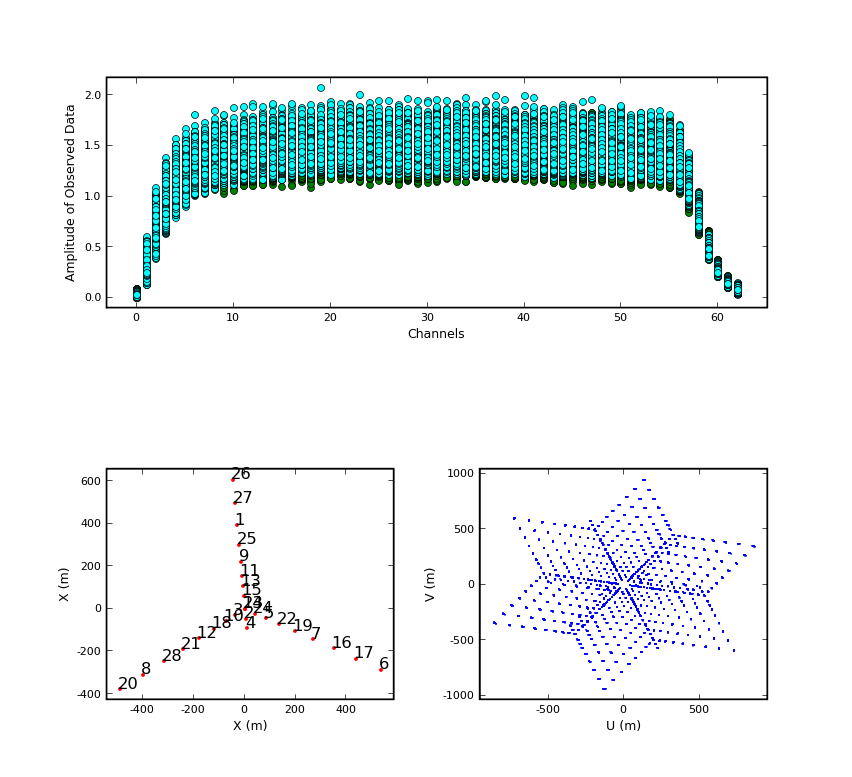
3.3.2.8 The subplot parameter
The subplot parameter takes three numbers. The first is the number of y panels (stacking vertically), the second is the number of xpanels (stacking horizontally) and the third is the number of the panel you want to draw into. For example, subplot=212 would draw into the lower of two panels stacked vertically in the figure.
An example use of subplot capability is shown in Fig 3.6. These were drawn with the commands (for the top, bottom left, and bottom right panels respectively):
field=’0’, # plot only first field
datacolumn=’corrected’, # plot corrected data
plotcolor=’’, # over-ride default plot color
plotsymbol=’go’, # use green circles
subplot=211) # plot to the top of two panels
plotxy(’n5921.ms’,’x’, # plot antennas for n5921.ms data set
field=’0’, # plot only first field
datacolumn=’corrected’, # plot corrected data
subplot=223, # plot to 3rd panel (lower left) in 2x2 grid
plotcolor=’’, # over-ride default plot color
plotsymbol=’r.’) # red dots
plotxy(’n5921.ms’,’u’,’v’, # plot uv-coverage for n5921.ms data set
field=’0’, # plot only first field
datacolumn=’corrected’, # plot corrected data
subplot=224, # plot to the lower right in a 2x2 grid
plotcolor=’’, # over-ride default plot color
plotsymbol=’b,’) # blue, somewhat larger dots
# NOTE: You can change the gridding
# and panel size by manipulating
# the ny x nx grid.
_________________________________________________________________________________________
See also § 3.3.2.3 above, and Figure 3.5 for an example of channel averaging using iteration and subplot.
More information about CASA may be found at the
CASA web page
Copyright © 2010 Associated Universities Inc., Washington, D.C.
This code is available under the terms of the GNU General Public Lincense
Home |
Contact Us |
Directories |
Site Map |
Help |
Privacy Policy |
Search