 National Radio
Astronomy Observatory
|
|
|||
| NRAO Home > CASA > CASA Cookbook and User Reference Manual |
|
||
7.3.4.2 Main window
The main window shows the spectrum extracted from the image. The unit of the spectral axis can be selected between frequency, wavelength and velocity units (available only if a rest frequency is given). The user can choose between the different combine types mean, median, sum and flux2 in a combo box. Besides the spectral values also the error bars can be plotted. The error values are either computed by propagating the pixel errors provided in the data (error type propagated) or by computing the root-mean squared error (error type rmse).
_________________________________________________________________________________________
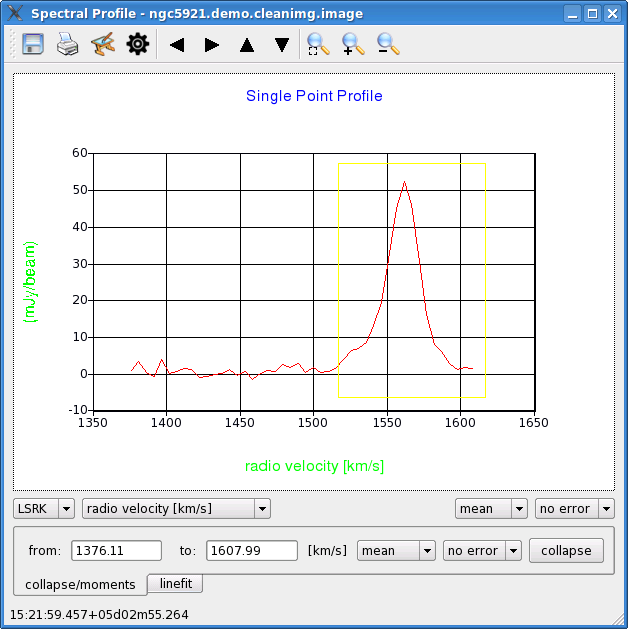
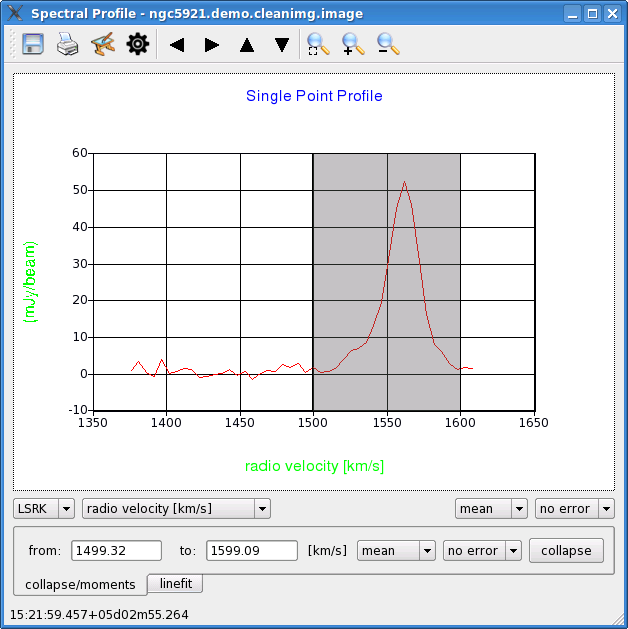
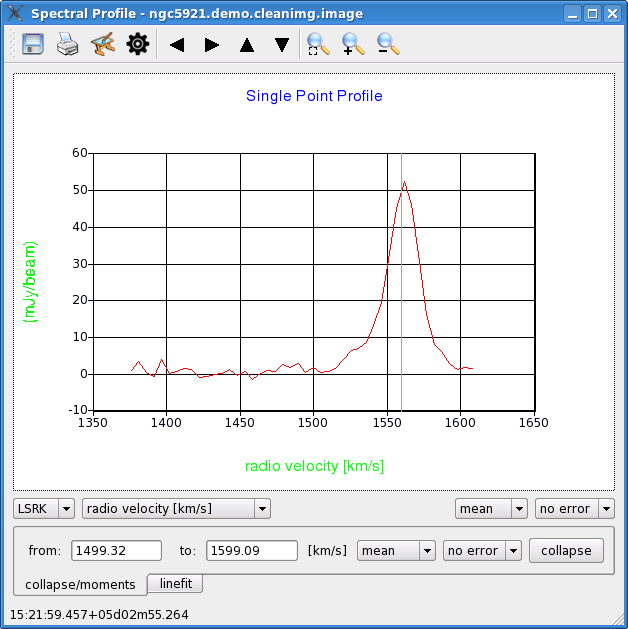
The main window is sensitive to the following combination input from keyboard and mouse (Figure 7.14):
- zoom: when pressing and dragging the left mouse button, a yellow box is drawn onto the panel. After releasing the mouse button, the xy-range is zoomed to the values of the yellow box (Fig. 7.14, left panel);
- spectral range selection: when pressing and dragging left mouse button with shift-key, a gray box marks a spectral range in the plot. The start and end values are written into the from: and to: box of the collapse/moments and linefit tab. This allows an interactive (Fig. 7.14, middle panel) selection of the spectral range used in the collapse/moments or linefit operation;
- specral channel selection: When pressing the ctr-key, a gray line is drawn at the current position of the mouse in the spectral profile window (Fig. 7.14, right panel). After pressing the right mouse button, the image in the Viewer Display Panel displays in the z-axis the spectral channel marked with the gray line.
More information about CASA may be found at the
CASA web page
Copyright © 2010 Associated Universities Inc., Washington, D.C.
This code is available under the terms of the GNU General Public Lincense
Home |
Contact Us |
Directories |
Site Map |
Help |
Privacy Policy |
Search