 National Radio
Astronomy Observatory
|
|
|||
| NRAO Home > CASA > CASA Cookbook and User Reference Manual |
|
||
7.3.4.3 Image analysis
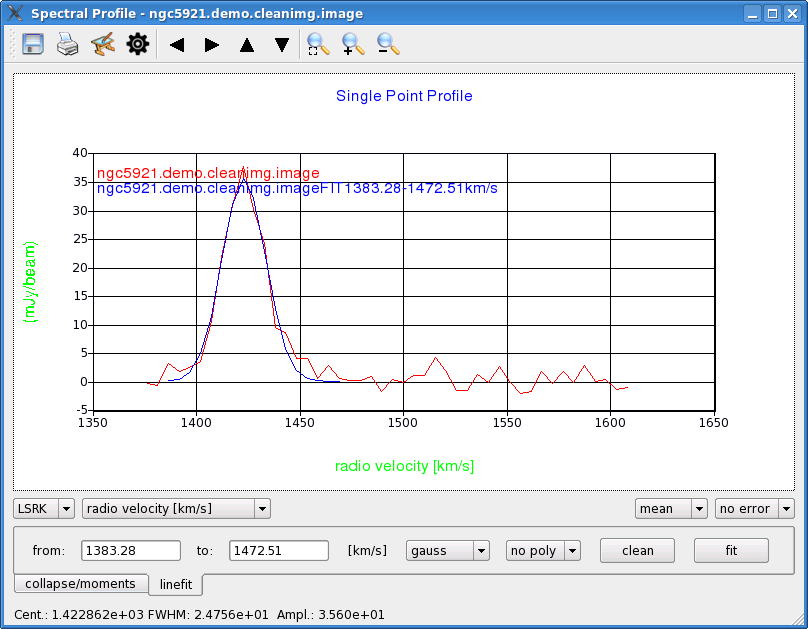
The two tabs labeled collapse/moments and linefit in the lower part of the Spectral Profile panel offer simple image analysis tools to the user (see Figs. 7.12 and 7.14).
In collapse/moments the user can collapse the image along the spectral axis between the start and end values provided in the corresponding boxes. Various collapse types (mean, median and sum) are offered, and the error is computed via error propagation from the pixel errors propagated or by computing the root-mean squared error (rmse). The collapsed image is displayed in the Viewer Display Panel.
_________________________________________________________________________________________
In linefit the user can fit a profile (Gaussian plus polynomial) to the spectrum profile (Figure 7.15). If error bars are displayed in the spectral profiler, they are used in the fitting as weights. The main results of the fit are shown in the status bar of the Spectral Profile. A detailed summary of the fit is sent to the standard output (either the casapy window or the window where the viewer was started).
More information about CASA may be found at the
CASA web page
Copyright © 2010 Associated Universities Inc., Washington, D.C.
This code is available under the terms of the GNU General Public Lincense
Home |
Contact Us |
Directories |
Site Map |
Help |
Privacy Policy |
Search