 National Radio
Astronomy Observatory
|
|
|||
| NRAO Home > CASA > CASA Cookbook and User Reference Manual |
|
||
7.3.4 Spectral Profile Plotting
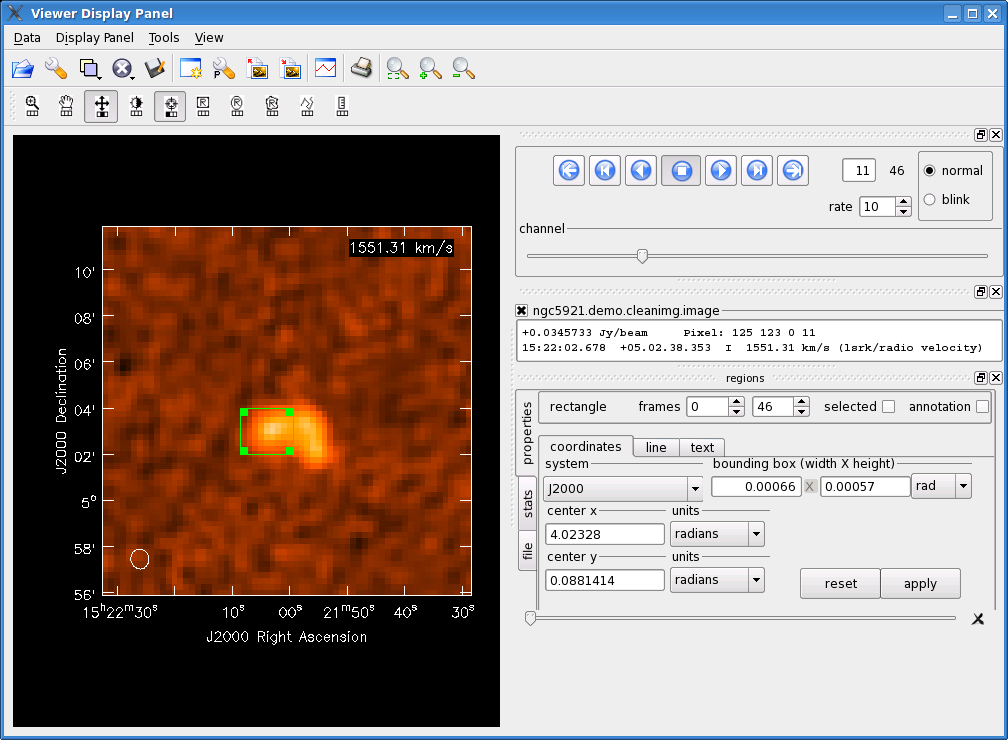
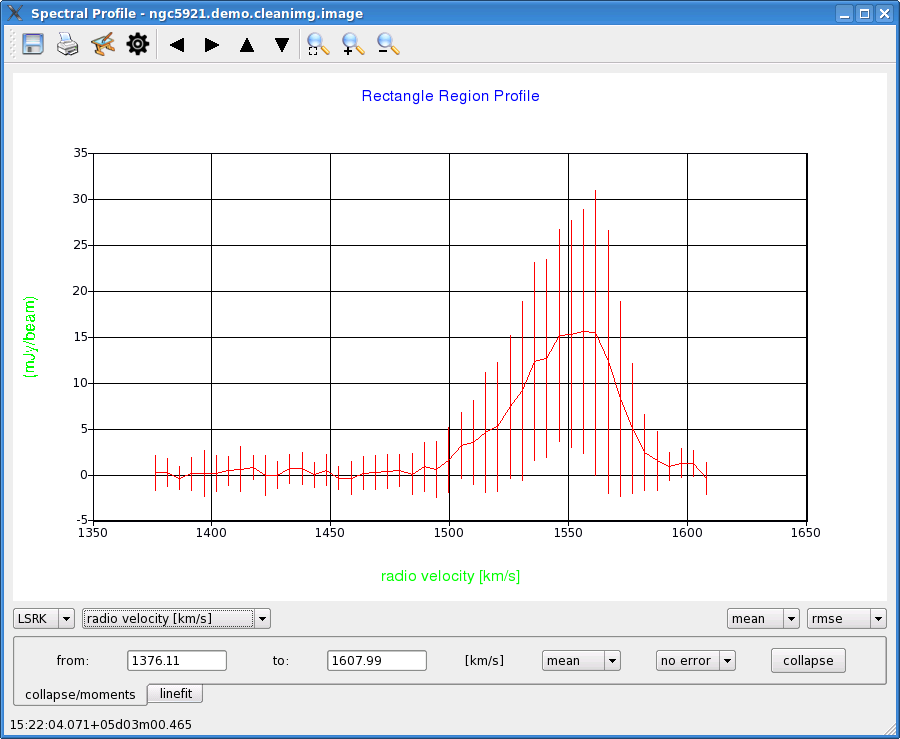
From the Main Toolbar (see Fig. 7.3), the Spectral Profile plotting tool can be selected. This creates a new Spectral Profile window containing an x-y plot of the intensity versus spectral axis. The displayed spectrum is extracted in region marked with the Point, Rectangle, Ellipse or Polygon Region tool in the Viewer Display Panel, where the values for extended regions are computed as the mean over all pixels within the marked region. For Point positions, it is possible to mark multiple positions position and switch between the positions by hovering over the respective markers (to remove points, hover over and hit ESC). The spectrum shown in the Spectral Profile window (right panel in Figure 7.12) is automatically updated if the corresponding region is dragged across the image in the Viewer Display Panel (right panel in Fig. 7.12).
_________________________________________________________________________________________
More information about CASA may be found at the
CASA web page
Copyright © 2010 Associated Universities Inc., Washington, D.C.
This code is available under the terms of the GNU General Public Lincense
Home |
Contact Us |
Directories |
Site Map |
Help |
Privacy Policy |
Search