|
casa
$Rev:20696$
|
|
casa
$Rev:20696$
|
Public Member Functions | |
| def | __init__ |
| def | clear |
| def | palette |
| def | delete |
| def | get_line |
| def | hist |
| def | hold |
| def | legend |
| def | plot |
| def | position |
| def | get_region |
| def | get_point |
| def | region |
| def | register |
| def | release |
| def | save |
| def | set_axes |
| def | set_figure |
| def | set_limits |
| def | set_line |
| def | set_panels |
| def | tidy |
| def | set_title |
| def | show |
| def | subplot |
| def | text |
| def | vline_with_label |
Public Attributes | |
| is_dead | |
| figure | |
| canvas | |
| subplots | |
| colormap | |
| lsalias | |
| linestyles | |
| color | |
| linestyle | |
| attributes | |
| loc | |
| buffering | |
| events | |
| lines | |
| rect | |
| axes | |
| rows | |
| cols | |
| title | |
| i | |
| figmgr | |
Private Member Functions | |
| def | _alive |
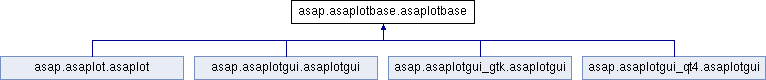
ASAP plotting base class based on matplotlib.
Definition at line 31 of file asaplotbase.py.
| def asap.asaplotbase.asaplotbase.__init__ | ( | self, | |
rows = 1, |
|||
cols = 0, |
|||
title = '', |
|||
size = None, |
|||
buffering = False |
|||
| ) |
Create a new instance of the ASAPlot plotting class.

If rows < 1 then a separate call to set_panels() is required to define
the panel layout; refer to the doctext for set_panels().
Reimplemented in asap.asaplotgui_gtk.asaplotgui, asap.asaplotgui.asaplotgui, asap.asaplotgui_qt4.asaplotgui, and asap.asaplot.asaplot.
Definition at line 36 of file asaplotbase.py.
| def asap.asaplotbase.asaplotbase._alive | ( | self | ) | [private] |
Definition at line 854 of file asaplotbase.py.
| def asap.asaplotbase.asaplotbase.clear | ( | self | ) |
Delete all lines from the plot. Line numbering will restart from 0.
Definition at line 90 of file asaplotbase.py.
References asap.asaplotbase.asaplotbase.color, asap.asaplotbase.asaplotbase.delete(), and asap.asaplotbase.asaplotbase.lines.
| def asap.asaplotbase.asaplotbase.delete | ( | self, | |
numbers = None |
|||
| ) |
Delete the 0-relative line number, default is to delete the last.
The remaining lines are NOT renumbered.
Definition at line 123 of file asaplotbase.py.
References asap.asaplotbase.asaplotbase.lines, __casac__.measures.measures.show(), asap.asaplotbase.asaplotbase.show(), and __casac__.plotms.plotms.show().
Referenced by asap.asaplotbase.asaplotbase.clear().
| def asap.asaplotbase.asaplotbase.get_line | ( | self | ) |
Get the current default line attributes.
Definition at line 142 of file asaplotbase.py.
References asap.asaplotbase.asaplotbase.attributes.
| def asap.asaplotbase.asaplotbase.get_point | ( | self | ) |
Definition at line 300 of file asaplotbase.py.
| def asap.asaplotbase.asaplotbase.get_region | ( | self | ) |
Definition at line 292 of file asaplotbase.py.
| def asap.asaplotbase.asaplotbase.hist | ( | self, | |
x = None, |
|||
y = None, |
|||
fmt = None, |
|||
add = None |
|||
| ) |
Plot a histogram.  N.B. the x values refer to the start of the
histogram bin.

fmt is the line style as in plot().
Definition at line 149 of file asaplotbase.py.
References __casac__.calplot.calplot.plot(), asap.asapgrid.asapgrid_base.plot(), asap.asaplotbase.asaplotbase.plot(), asap.asapgrid.asapgrid.plot(), __casac__.msplot.msplot.plot(), asap.asapgrid._SDGridPlotter.plot(), and asap.asapfitter.fitter.plot().
| def asap.asaplotbase.asaplotbase.hold | ( | self, | |
hold = True |
|||
| ) |
Buffer graphics until subsequently released.
Definition at line 189 of file asaplotbase.py.
References asap.asaplotbase.asaplotbase.buffering.
| def asap.asaplotbase.asaplotbase.legend | ( | self, | |
loc = None |
|||
| ) |
Add a legend to the plot.

Any other value for loc else disables the legend:
     1: upper right
     2: upper left
     3: lower left
     4: lower right
     5: right
     6: center left
     7: center right
     8: lower center
     9: upper center
    10: center
Definition at line 196 of file asaplotbase.py.
References asap.asaplotbase.asaplotbase.loc.
| def asap.asaplotbase.asaplotbase.palette | ( | self, | |
| color, | |||
colormap = None, |
|||
linestyle = 0, |
|||
linestyles = None |
|||
| ) |
Definition at line 101 of file asaplotbase.py.
References asap.asaplotbase.asaplotbase.color, asap.asaplotbase.asaplotbase.colormap, asap.asaplotbase.asaplotbase.linestyle, and asap.asaplotbase.asaplotbase.linestyles.
Referenced by asap.asaplotbase.asaplotbase.set_line().
| def asap.asaplotbase.asaplotbase.plot | ( | self, | |
x = None, |
|||
y = None, |
|||
fmt = None, |
|||
add = None |
|||
| ) |
Plot the next line in the current frame using the current line
attributes.  The ASAPlot graphics window will be mapped and raised.

The argument list works a bit like the matlab plot() function.
Definition at line 221 of file asaplotbase.py.
References asap.asaplotbase.asaplotbase.color, asap.asaplotbase.asaplotbase.colormap, asap.asaplotbase.asaplotbase.lines, asap.asaplotbase.asaplotbase.linestyle, asap.asaplotbase.asaplotbase.linestyles, __casac__.measures.measures.show(), asap.asaplotbase.asaplotbase.show(), and __casac__.plotms.plotms.show().
Referenced by task_sdgrid.sdgrid_worker.finalize(), asap.asaplotbase.asaplotbase.hist(), asap.asapplotter.asapplotter.set_abcissa(), asap.asapplotter.asapplotter.set_colors(), asap.asapplotter.asapplotter.set_data(), asap.asapplotter.asapplotter.set_font(), asap.asapplotter.asapplotter.set_histogram(), asap.asapplotter.asapplotter.set_layout(), asap.asapplotter.asapplotter.set_legend(), asap.asapplotter.asapplotter.set_linestyles(), asap.asapplotter.asapplotter.set_margin(), asap.asapplotter.asapplotter.set_mask(), asap.asapplotter.asapplotter.set_mode(), asap.asapplotter.asapplotter.set_ordinate(), asap.asapplotter.asapplotter.set_range(), asap.asapplotter.asapplotter.set_selection(), and asap.asapplotter.asapplotter.set_title().
| def asap.asaplotbase.asaplotbase.position | ( | self | ) |
Use the mouse to get a position from a graph.
Definition at line 279 of file asaplotbase.py.
References asap.asaplotbase.asaplotbase.register().
| def asap.asaplotbase.asaplotbase.region | ( | self | ) |
Use the mouse to get a rectangular region from a plot.

The return value is [x0, y0, x1, y1] in world coordinates.
Definition at line 308 of file asaplotbase.py.
| def asap.asaplotbase.asaplotbase.register | ( | self, | |
type = None, |
|||
func = None |
|||
| ) |
Register, reregister, or deregister events of type 'button_press',
'button_release', or 'motion_notify'.

The specified callback function should have the following signature:

    def func(event)

where event is an MplEvent instance containing the following data:

    name                # Event name.
    canvas              # FigureCanvas instance generating the event.
    x      = None       # x position - pixels from left of canvas.
    y      = None       # y position - pixels from bottom of canvas.
    button = None       # Button pressed: None, 1, 2, 3.
    key    = None       # Key pressed: None, chr(range(255)), shift,
                  win, or control
    inaxes = None       # Axes instance if cursor within axes.
    xdata  = None       # x world coordinate.
    ydata  = None       # y world coordinate.

For example:

    def mouse_move(event):
print event.xdata, event.ydata

    a = asaplot()
    a.register('motion_notify', mouse_move)

If func is None, the event is deregistered.

Note that in TkAgg keyboard button presses don't generate an event.
Definition at line 345 of file asaplotbase.py.
References asap.asaplotbase.asaplotbase.events.
Referenced by asap.asaplotbase.asaplotbase.position().
| def asap.asaplotbase.asaplotbase.release | ( | self | ) |
Release buffered graphics.
Definition at line 403 of file asaplotbase.py.
References asap.asaplotbase.asaplotbase.buffering, __casac__.measures.measures.show(), asap.asaplotbase.asaplotbase.show(), and __casac__.plotms.plotms.show().
| def asap.asaplotbase.asaplotbase.save | ( | self, | |
fname = None, |
|||
orientation = None, |
|||
dpi = None, |
|||
papertype = None |
|||
| ) |
Save the plot to a file.

fname is the name of the output file.  The image format is determined
from the file suffix; 'png', 'ps', and 'eps' are recognized.  If no
file name is specified 'yyyymmdd_hhmmss.png' is created in the current
directory.
Definition at line 411 of file asaplotbase.py.
| def asap.asaplotbase.asaplotbase.set_axes | ( | self, | |
what = None, |
|||
| args, | |||
| kwargs | |||
| ) |
Set attributes for the axes by calling the relevant Axes.set_*()
method.  Colour translation is done as described in the doctext
for palette().
Definition at line 479 of file asaplotbase.py.
References asap.asaplotbase.asaplotbase.axes, __casac__.measures.measures.show(), asap.asaplotbase.asaplotbase.show(), and __casac__.plotms.plotms.show().
| def asap.asaplotbase.asaplotbase.set_figure | ( | self, | |
what = None, |
|||
| args, | |||
| kwargs | |||
| ) |
Set attributes for the figure by calling the relevant Figure.set_*()
method.  Colour translation is done as described in the doctext
for palette().
Definition at line 499 of file asaplotbase.py.
References asap.asaplotbase.asaplotbase.figure, __casac__.measures.measures.show(), asap.asaplotbase.asaplotbase.show(), and __casac__.plotms.plotms.show().
| def asap.asaplotbase.asaplotbase.set_limits | ( | self, | |
xlim = None, |
|||
ylim = None |
|||
| ) |
Set x-, and y-limits for each subplot.

xlim = [xmin, xmax] as in axes.set_xlim().
ylim = [ymin, ymax] as in axes.set_ylim().
Definition at line 521 of file asaplotbase.py.
References asap.asaplotbase.asaplotbase.subplots.
| def asap.asaplotbase.asaplotbase.set_line | ( | self, | |
number = None, |
|||
| kwargs | |||
| ) |
Set attributes for the specified line, or else the next line(s)
to be plotted.

number is the 0-relative number of a line that has already been
plotted.  If no such line exists, attributes are recorded and used
for the next line(s) to be plotted.

Keyword arguments specify Line2D attributes, e.g. color='r'.  Do

    import matplotlib
    help(matplotlib.lines)

The set_* methods of class Line2D define the attribute names and
values.  For non-US usage, 'colour' is recognized as synonymous with
'color'.

Set the value to None to delete an attribute.

Colour translation is done as described in the doctext for palette().
Definition at line 546 of file asaplotbase.py.
References asap.asaplotbase.asaplotbase.palette().
| def asap.asaplotbase.asaplotbase.set_panels | ( | self, | |
rows = 1, |
|||
cols = 0, |
|||
n = -1, |
|||
nplots = -1, |
|||
margin = None, |
|||
ganged = True |
|||
| ) |
Set the panel layout.

rows and cols, if cols != 0, specify the number of rows and columns in
a regular layout.   (Indexing of these panels in matplotlib is row-
major, i.e. column varies fastest.)

cols == 0 is interpreted as a retangular layout that accomodates
'rows' panels, e.g. rows == 6, cols == 0 is equivalent to
rows == 2, cols == 3.

0 <= n < rows*cols is interpreted as the 0-relative panel number in
the configuration specified by rows and cols to be added to the
current figure as its next 0-relative panel number (i).  This allows
non-regular panel layouts to be constructed via multiple calls.  Any
other value of n clears the plot and produces a rectangular array of
empty panels.  The number of these may be limited by nplots.
Definition at line 589 of file asaplotbase.py.
Referenced by asap.asaplotbase.asaplotbase.subplot().
| def asap.asaplotbase.asaplotbase.set_title | ( | self, | |
title = None |
|||
| ) |
Set the title of the plot window.  Use the previous title if title is
omitted.
Definition at line 719 of file asaplotbase.py.
| def asap.asaplotbase.asaplotbase.show | ( | self, | |
hardrefresh = True |
|||
| ) |
Show graphics dependent on the current buffering state.
Reimplemented in asap.asaplotgui_qt4.asaplotgui, asap.asaplotgui_gtk.asaplotgui, and asap.asaplotgui.asaplotgui.
Definition at line 730 of file asaplotbase.py.
Referenced by imageTest.ImageTest._retryFit(), imageTest.ImageTest.bmodel(), imageTest.ImageTest.bmodel_old(), asap.asaplotbase.asaplotbase.delete(), asap.asaplotbase.asaplotbase.plot(), asap.asaplotbase.asaplotbase.release(), asap.asaplotbase.asaplotbase.set_axes(), asap.asaplotbase.asaplotbase.set_figure(), and imageTest.ImageTest.simple_stats().
| def asap.asaplotbase.asaplotbase.subplot | ( | self, | |
i = None, |
|||
inc = None |
|||
| ) |
Set the subplot to the 0-relative panel number as defined by one or
more invokations of set_panels().
Definition at line 782 of file asaplotbase.py.
References asap.asaplotbase.asaplotbase.set_panels().
| def asap.asaplotbase.asaplotbase.text | ( | self, | |
| args, | |||
| kwargs | |||
| ) |
Add text to the figure.
Definition at line 799 of file asaplotbase.py.
Referenced by asap.asapplotter.asapplotter.create_mask().
| def asap.asaplotbase.asaplotbase.tidy | ( | self | ) |
Definition at line 700 of file asaplotbase.py.
| def asap.asaplotbase.asaplotbase.vline_with_label | ( | self, | |
| x, | |||
| y, | |||
| label, | |||
location = 'bottom', |
|||
rotate = 0.0, |
|||
| kwargs | |||
| ) |
Plot a vertical line with label.
It takes "world" values fo x and y.
Definition at line 807 of file asaplotbase.py.
Definition at line 81 of file asaplotbase.py.
Referenced by asap.asaplotbase.asaplotbase.get_line().
Definition at line 529 of file asaplotbase.py.
Referenced by asap.asaplotbase.asaplotbase.set_axes().
Definition at line 84 of file asaplotbase.py.
Referenced by asap.asaplotbase.asaplotbase.hold(), asap.asaplotbase.asaplotbase.release(), asap.asaplotgui.asaplotgui.show(), asap.asaplotgui_gtk.asaplotgui.show(), and asap.asaplotgui_qt4.asaplotgui.show().
Reimplemented in asap.asaplotgui.asaplotgui, asap.asaplotgui_gtk.asaplotgui, asap.asaplotgui_qt4.asaplotgui, and asap.asaplot.asaplot.
Definition at line 45 of file asaplotbase.py.
Referenced by asap.customgui_tkagg.NotationWindowTkAgg._modify_note(), asap.customgui_qt4agg.NotationWindowQT4Agg._modify_note(), asap.customgui_base.NotationWindowCommon.print_text(), asap.asaplotgui_gtk.asaplotgui.quit(), and asap.asaplotgui_qt4.asaplotgui.quit().
Definition at line 79 of file asaplotbase.py.
Referenced by asap.asaplotbase.asaplotbase.clear(), gprof2dot.Theme.edge_color(), gprof2dot.DotWriter.graph(), gprof2dot.Theme.node_bgcolor(), asap.asaplotbase.asaplotbase.palette(), and asap.asaplotbase.asaplotbase.plot().
Definition at line 53 of file asaplotbase.py.
Referenced by task_sdplot.sdplot_worker.__setup_plotter(), asap.asaplotbase.asaplotbase.palette(), and asap.asaplotbase.asaplotbase.plot().
Definition at line 640 of file asaplotbase.py.
Referenced by TablePlotQt4Agg.PlotFlag.draw_rect(), TablePlotQt4Agg.PlotFlag.press_flag(), TablePlotTkAgg.PlotFlag.press_markregion(), TablePlotQt4Agg.PlotFlag.release_flag(), and TablePlotTkAgg.PlotFlag.release_markregion().
Definition at line 86 of file asaplotbase.py.
Referenced by gprof2dot.Object.__contains__(), gprof2dot.Object.__getitem__(), gprof2dot.Object.__setitem__(), and asap.asaplotbase.asaplotbase.register().
Reimplemented in asap.asaplotgui.asaplotgui, asap.asaplotgui_gtk.asaplotgui, asap.asaplotgui_qt4.asaplotgui, and asap.asaplot.asaplot.
Definition at line 863 of file asaplotbase.py.
Referenced by asap.asaplotgui_gtk.asaplotgui.quit(), and asap.asaplotgui_qt4.asaplotgui.quit().
Definition at line 44 of file asaplotbase.py.
Referenced by asap.lagflagger.lagplotter._init_plot(), and asap.asaplotbase.asaplotbase.set_figure().
Definition at line 790 of file asaplotbase.py.
Reimplemented in asap.asaplotgui.asaplotgui, asap.asaplotgui_qt4.asaplotgui, and asap.asaplotgui_gtk.asaplotgui.
Definition at line 43 of file asaplotbase.py.
Referenced by asap.asaplotgui.asaplotgui.map(), asap.asaplotgui_gtk.asaplotgui.map(), asap.asaplotgui_qt4.asaplotgui.map(), asap.asaplotgui_gtk.asaplotgui.quit(), asap.asaplotgui_qt4.asaplotgui.quit(), asap.asaplotgui.asaplotgui.show(), asap.asaplotgui_gtk.asaplotgui.show(), and asap.asaplotgui_qt4.asaplotgui.show().
Definition at line 99 of file asaplotbase.py.
Referenced by asap.asaplotbase.asaplotbase.clear(), asap.asaplotbase.asaplotbase.delete(), and asap.asaplotbase.asaplotbase.plot().
Definition at line 80 of file asaplotbase.py.
Referenced by asap.asaplotbase.asaplotbase.palette(), and asap.asaplotbase.asaplotbase.plot().
Definition at line 77 of file asaplotbase.py.
Referenced by asap.asaplotbase.asaplotbase.palette(), and asap.asaplotbase.asaplotbase.plot().
Definition at line 82 of file asaplotbase.py.
Referenced by asap.asaplotbase.asaplotbase.legend().
Definition at line 59 of file asaplotbase.py.
Definition at line 639 of file asaplotbase.py.
Referenced by gprof2dot.AQtimeTable.__iter__(), gprof2dot.AQtimeTable.__len__(), TablePlotQt4Agg.PlotFlag.draw_rect(), TablePlotQt4Agg.PlotFlag.press_flag(), TablePlotTkAgg.PlotFlag.press_markregion(), TablePlotQt4Agg.PlotFlag.release_flag(), and TablePlotTkAgg.PlotFlag.release_markregion().
Definition at line 48 of file asaplotbase.py.
Referenced by asap.asaplotbase.asaplotbase.set_limits().
Definition at line 725 of file asaplotbase.py.
Referenced by tw_utils.htmlPub.doTitle(), and regressframe.regressionframe.run().
 1.8.0
1.8.0

