|
casa
5.7.0-16
|
|
casa
5.7.0-16
|
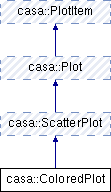
An color plot is a scatter plot with differentiated colors for points in different bins. More...
#include <Plot.h>

Public Member Functions | |
| ColoredPlot () | |
| Constructor. More... | |
| virtual | ~ColoredPlot () |
| Destructor. More... | |
| virtual PlotPointDataPtr | pointData () const |
| Overrides ScatterPlot::pointData(). More... | |
| virtual PlotBinnedDataPtr | binnedColorData () const =0 |
| ABSTRACT METHODS //. More... | |
| virtual PlotColorPtr | colorForBin (unsigned int bin) const =0 |
| Returns the color to use for the bin at the given index. More... | |
| virtual void | setColorForBin (unsigned int bin, const PlotColorPtr color)=0 |
| Sets the color to use for the bin at the given index. More... | |
 Public Member Functions inherited from casa::ScatterPlot Public Member Functions inherited from casa::ScatterPlot | |
| ScatterPlot () | |
| virtual | ~ScatterPlot () |
| virtual PlotDataPtr | data () const |
| Overrides Plot::data(). More... | |
| virtual ppoint_t | pointAt (unsigned int i) const |
| Returns the data value at the given index. More... | |
| virtual unsigned int | drawCount () const |
| Implements PlotItem::drawCount(). More... | |
| virtual bool | linesStep () const =0 |
| Get/set to connect points in step rather than line. More... | |
| virtual void | setLinesStep (bool linesStep=true)=0 |
| virtual bool | symbolsShown () const =0 |
| Returns true if symbols are shown, false otherwise. More... | |
| virtual void | setSymbolsShown (bool symbolsShown=true)=0 |
| Sets whether symbols are shown or not. More... | |
| virtual PlotSymbolPtr | symbol () const =0 |
| Returns a copy of the symbol for this plot. More... | |
| virtual void | setSymbol (const PlotSymbol &symbol)=0 |
| Sets the plot symbols to the given symbol. More... | |
| virtual void | setSymbol (const PlotSymbolPtr symbol) |
| IMPLEMENTED METHODS //. More... | |
| virtual void | setSymbol (PlotSymbol::Symbol s) |
| virtual void | setSymbol (char s) |
| virtual void | setSymbolSize (double width, double height) |
| virtual void | setSymbolLine (const PlotLine &line) |
| virtual void | setSymbolLine (const PlotLinePtr line) |
| virtual void | setSymbolLine (const casacore::String &color, PlotLine::Style style=PlotLine::SOLID, double width=1.0) |
| virtual void | setSymbolAreaFill (const PlotAreaFill &fill) |
| virtual void | setSymbolAreaFill (const PlotAreaFillPtr fill) |
| virtual void | setSymbolAreaFill (const casacore::String &color, PlotAreaFill::Pattern pattern=PlotAreaFill::FILL) |
 Public Member Functions inherited from casa::Plot Public Member Functions inherited from casa::Plot | |
| Plot () | |
| virtual | ~Plot () |
| virtual void | dataChanged ()=0 |
| Should be called whenever the underlying PlotData has changed, to let the plot and its attached canvas know that the plot needs to be redrawn. More... | |
| virtual bool | linesShown () const =0 |
| It's likely that any plot subclass (scatter, bar, function, etc.) will have lines of some sort, so it's safe to have in the base class. More... | |
| virtual void | setLinesShown (bool linesShown=true)=0 |
| Sets whether or not lines are shown. More... | |
| virtual PlotLinePtr | line () const =0 |
| Returns a copy of the line used for this plot. More... | |
| virtual void | setLine (const PlotLine &line)=0 |
| Sets the plot lines to the given line. More... | |
| virtual void | setLine (const PlotLinePtr line) |
| IMPLEMENTED METHODS //. More... | |
| virtual void | setLine (const casacore::String &color, PlotLine::Style style=PlotLine::SOLID, double width=1.0) |
| virtual void | setLineColor (const casacore::String &color) |
| virtual void | setLineStyle (PlotLine::Style style) |
| virtual void | setLineWidth (double width) |
 Public Member Functions inherited from casa::PlotItem Public Member Functions inherited from casa::PlotItem | |
| PlotItem () | |
| Constructor. More... | |
| virtual | ~PlotItem () |
| Destructor. More... | |
| virtual PlotCanvas * | canvas () const =0 |
| Returns the canvas this item is currently attached to, or NULL for none. More... | |
| virtual casacore::String | title () const =0 |
| Returns a human-readable title for identification. More... | |
| virtual void | setTitle (const casacore::String &newTitle)=0 |
| Sets this items's title to the given. More... | |
| virtual bool | isValid () const =0 |
| Returns true if this item is valid, false otherwise. More... | |
| virtual bool | isQWidget () const =0 |
| Returns whether this item can be directly casted to a QWidget or not. More... | |
| virtual PlotAxis | xAxis () const =0 |
| Returns the item's axes. More... | |
| virtual PlotAxis | yAxis () const =0 |
| virtual void | setXAxis (PlotAxis x)=0 |
| Sets the item's axes. More... | |
| virtual void | setYAxis (PlotAxis y)=0 |
| virtual void | setAxes (PlotAxis x, PlotAxis y) |
| Sets both the item's axes at once. More... | |
| virtual unsigned int | drawSegments (unsigned int segmentThreshold) const |
| Returns the number of draw segments for this item, using the given segment threshold. More... | |
An color plot is a scatter plot with differentiated colors for points in different bins.
It is expected to consist of PlotBinnedData.
|
inlinevirtual |
|
pure virtual |
|
pure virtual |
Returns the color to use for the bin at the given index.
The color applies to the symbol fill color.
|
inlinevirtual |
Overrides ScatterPlot::pointData().
Implements casa::ScatterPlot.
Definition at line 457 of file Plot.h.
References binnedColorData().
|
pure virtual |
Sets the color to use for the bin at the given index.
The color applies to the symbol fill color.
 1.8.5
1.8.5