 National Radio
Astronomy Observatory
|
|
|||
| NRAO Home > CASA > CASA Cookbook and User Reference Manual |
|
||
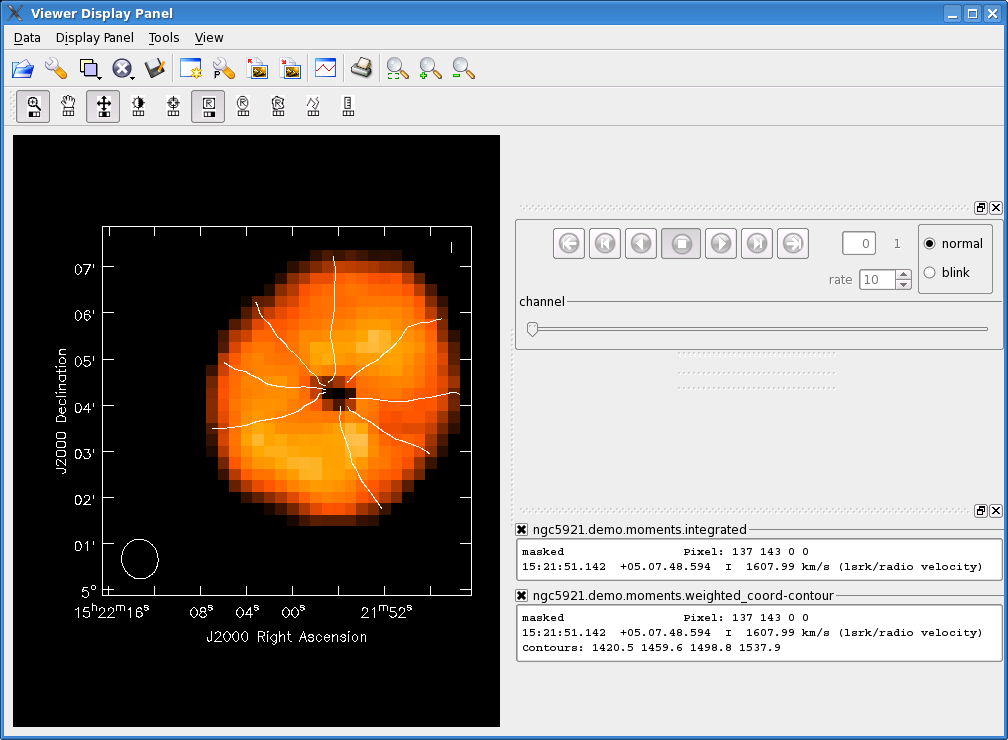
7.3.3 Overlay contours on a raster map
Contours of either a second data set or the same data set can be used for comparison or to enhance visualization of the data. The Data Options Panel will have multiple tabs which allow adjusting each overlay individually (Note tabs along the top). Beware: it’s easy to forget which tab is active! Also note that axis labeling is controlled by the first-registered image overlay that has labeling turned on (whether raster or contour), so make label adjustments within that tab.
To add a Contour overlay, open the Load Data panel (Use the Data menu or click on the folder icon), select the data set and click on contour map. See Figure 7.11 for an example using NGC5921.

_________________________________________________________________________________________
More information about CASA may be found at the
CASA web page
Copyright © 2010 Associated Universities Inc., Washington, D.C.
This code is available under the terms of the GNU General Public Lincense
Home |
Contact Us |
Directories |
Site Map |
Help |
Privacy Policy |
Search