 National Radio
Astronomy Observatory
|
|
|||
| NRAO Home > CASA > CASA Cookbook and User Reference Manual |
|
||
7.3 Viewing Images
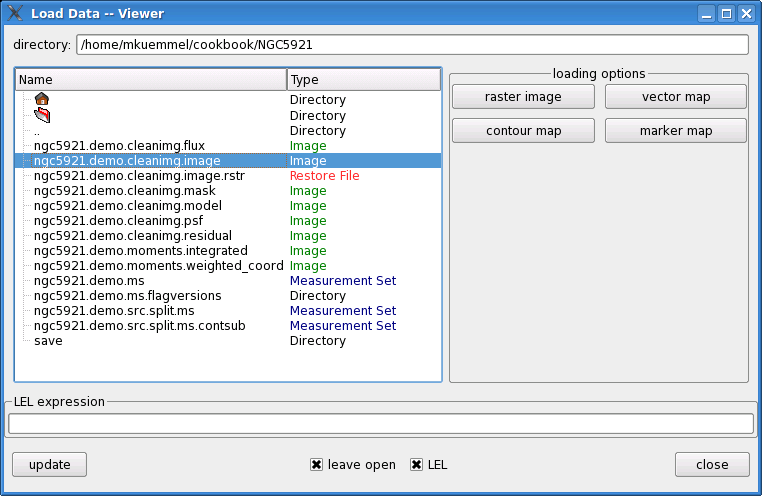
There are several options for viewing an image. These are seen at the right of the Load Data - Viewer panel described in § 7.2.4 and shown in Figure 7.7 after selecting an image. They are:
- raster image — a greyscale or color image,
- contour map — contours of intensity as a line plot,
- vector map — vectors (as in polarization) as a line plot,
- marker map — a line plot with symbols to mark positions.
The raster image is the default image display, and is what you get if you invoke the viewer from casapy with an image file name. In this case, you will need to use the Open menu to bring up the Load Data panel to choose a different display.
_________________________________________________________________________________________
7.3.1.1 Raster image — display axes
7.3.1.2 Raster image — basic settings
7.3.1.3 Raster image — other settings
7.3.2 Viewing a contour map
7.3.3 Overlay contours on a raster map
7.3.4 Spectral Profile Plotting
7.3.4.1 Toolbar
7.3.4.2 Main window
7.3.4.3 Image analysis
7.3.5 Managing Regions and Annotations
7.3.5.1 Region Panel: properties
7.3.5.2 Region Panel: stats
7.3.5.3 Region Panel: file
7.3.6 Adjusting Canvas Parameters/Multi-panel displays
7.3.6.1 Setting up multi-panel displays
7.3.6.2 Background Color
More information about CASA may be found at the
CASA web page
Copyright © 2010 Associated Universities Inc., Washington, D.C.
This code is available under the terms of the GNU General Public Lincense
Home |
Contact Us |
Directories |
Site Map |
Help |
Privacy Policy |
Search