
 News News |
FAQ
|
| Search
|
Home
|
| Getting Started | Documentation | Glish | Learn More | Programming | Contact Us |
|
| Version 1.9 Build 1556 |
|


To demonstrate the use of the Tool Manager, we will now make an image. For completeness, we also show how to accomplish the same goal using the Glish command line.
When you start AIPS++, only package general, which is for
general processing, is automatically loaded and readily available for
use. In order to access other packages or modules it is
necessary to explicitly load them.
include 'synthesis.g'  # load the synthesis package
include 'table.g'      # load the table tool
include 'ms.g'         # load the module ms
include 'msplot.g'     # load the ms plotting function
include 'utility.g'    # load the utilities module
If you write your own script (e.g., myscript.g), then to
execute the script:
include 'myscript.g' # execute myscript.g
For our example, we will need to create a UV data set in the AIPS++ format from the data which has been supplied with the AIPS++ distribution for test purposes. It is a continuum data of the radio
source 3C273, taken using the VLA C-array at a frequency near 8.5
GHz. To create this data set in your directory in standard AIPS++ format, do the following:
include 'imager.g'              # Load imager definitions
imagermaketestms('3C273XC1.ms') # Make the MeasurementSet
The global function imagermaketestms creates the MeasurementSet with the name '3C273XC1.ms' from s FITS data file supplied with the AIPS++ distribution.
If the File Catalog is running, click the Refresh or Show button on the File Catalog GUI and notice that a new file name '3C273XC1.ms' has been added to the directory. Select this file by clicking it and then click Summarize to get a brief summary of the MeasurementSet on the Logger window.
To make images from this UV data set:
myimager:=imager('3C273XC1.ms')
myimager.setimage(cellx='0.7arcsec',celly='0.7arcsec',
                  nx=300,ny=300)
myimager.clean(image='3C273XC1.restored', model='3C273XC1.clean',
               residual='3C273XC1.residual')
When these operations are finished, click the Show button on the File Catalog GUI to see the new entries.
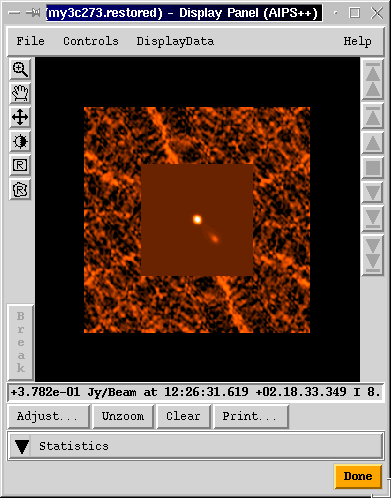
Images are best viewed using the Viewer. The Viewer can be
invoked in a number of different ways.
In the File Catalog, double click on the Image name
include 'catalog.g'
dc.view('3C273XC1.restored')
include 'image.g'
myimage:=image('3C273XC1.restored')
myimage.view();
This pops up a window for viewing the image. Be patient when doing this for the first time in a session. Loading the Viewer currently takes about 10-15 seconds. Subsequent views will be very quick. More than one image can be viewed at the same time. Double clicking on a second image brings up another display panel.
The Viewer has many other capabilities. For example, to overlay
a raster display with a contour display (not necessarily of the
same image), follow these steps:
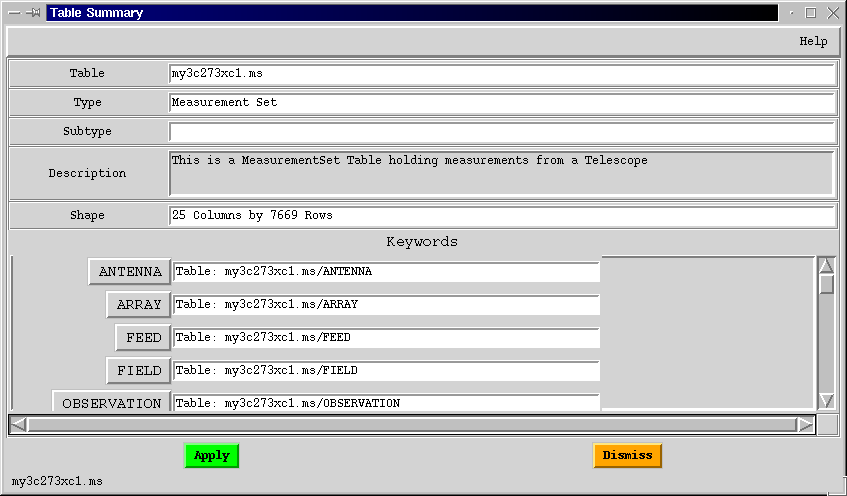
The MeasurementSet 3C273XC1.ms and the images 3C273XC1.restored are AIPS++ Tables. As mentioned earlier, a Table in AIPS++ is actually stored as a directory with the same name as the Tbale. For instance, in the File Catalog GUI click on the file name 3C273XC1.ms and then click Show. The File Catalog GUI now displays the list of files in the directory named 3C273XC1.ms. AIPS++ knows to recognize this whole collection of files and subdirectories as a single Table. Similarly, 3C273XC1.restored is a Table representing the restored image and contains many files under the directory with its name. Restore the File Catalog GUI to the display the contents of your main AIPS++ directory by selecting [..] in the File Name column and click Show.
Although you may not do this during regular processing of the data from a telescope, it is useful at this stage to have a look at the insides of an MS and how it is orgnized in AIPS++. To do this you will use the Table Browser GUI..
The Table Browser GUI has many options, for example, you can pull out all
of the entries of a given column into a Glish array, manipulate
it and put it back. You can also plot one column, or a mathematical
combination of several columns against other columns or their
combinations. Here you will use it just to browse the Table.
t:=table('3C273XC1.ms') # to make a table tool.
t.browse()              # to invoke the browse function.
t.close()               # when finished, close the tool
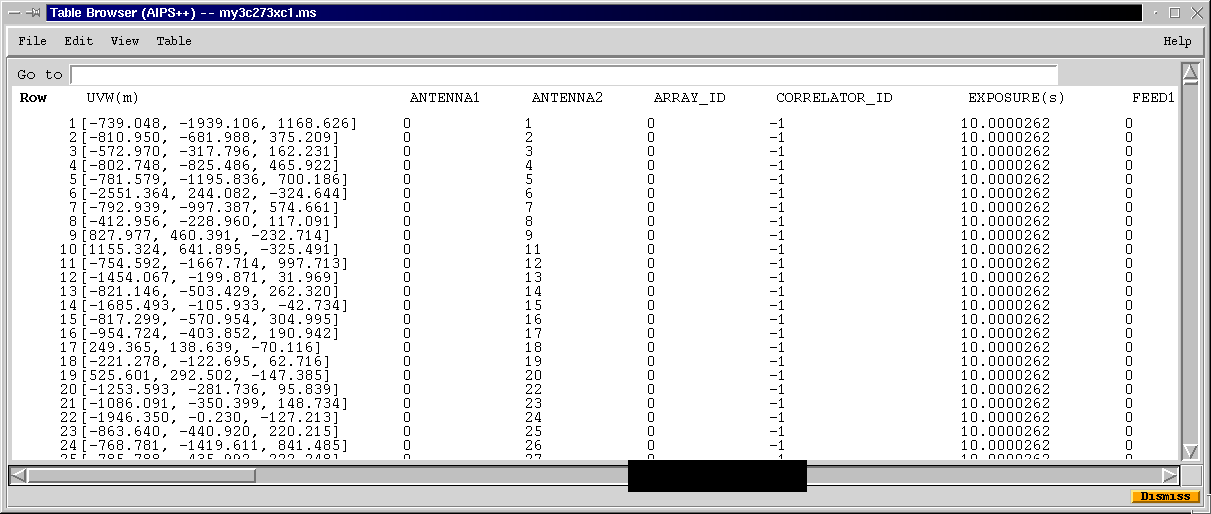
After you examine this Table, be sure to use the Dismiss button on this GUI to close the window. Otherwise you will end up with a lot of GUIs on your screen.
Having browsed through some of the sub-Tables of the MS, you can now dismiss the Summary GUI by clicking Dismiss, and remove the Table Browser GUI by choosing Exit under its File menu.
Another example of an Image is the Table 3C273XC1.restored. Images are best viewed using the Viewer, which is invoked by selecting the file name on the File Catalog GUI and clicking the View button. However, although it is not very instructive, you can also use the Table Browser GUI to get a feel for the Image Table.